Want to create infographics with AI and save hours of design work? You’re in the right place. In this guide, we’ll explore 5 of the best AI tools to create professional infographics, even if you have zero design experience.
AI-powered infographic tools make the process faster, easier, and cost-effective, allowing you to create stunning visuals for websites, social media, or presentations. No need for complicated software—just intelligent AI that does the heavy lifting.
Ready to design your first infographic with AI? Let’s dive in!
5 Best AI Infographic Generators for 2026
With the help of the following AI tools, you can generate highly informative, engaging, and professional infographics in no time.
1. Use Google Gemini to Create Highly Professional and Interactive Infographics
Since the launch of 2.5 Flash in Google’s Gemini AI, it has garnered a significant following. Also, Veo 3 has taken the AI video generation industry by storm. You get highly professional, lip-synced videos that no one can say are generated by an AI.
Furthermore, its Deep Research functionality provides a better report than other AI tools like Perplexity or ChatGPT. The time it takes to conduct research and generate a report is longer than others; however, the time taken is indicative of its worth because it not only analyzes over 100 web pages but also examines videos, study papers, and over a thousand pieces of data available in the database.
And once the research is complete, you receive a comprehensive report; none of the AI tools can do it on their own.
But we are here to create infographics.
Well, the Gemini 2.5 Flash version also makes that possible, and it does so in the most adaptable way.
It doesn’t provide you with a graphic or prompts, but offers a code that you can use on a website to present your users with interactive information. Additionally, the infographics it designs are highly readable, featuring engaging fonts, icons, and workflows.
You can share the infographic across various platforms or preview it via the provided link.
But how can you use it to make interactive infographics?
Follow the steps below to find out.
How to Make Interactive Infographics With Google Gemini
To create infographics with Gemini, you don’t need to have a premium plan. You can also create infographics on the free plan.
However, if you have the premium plan, it will be worth it.
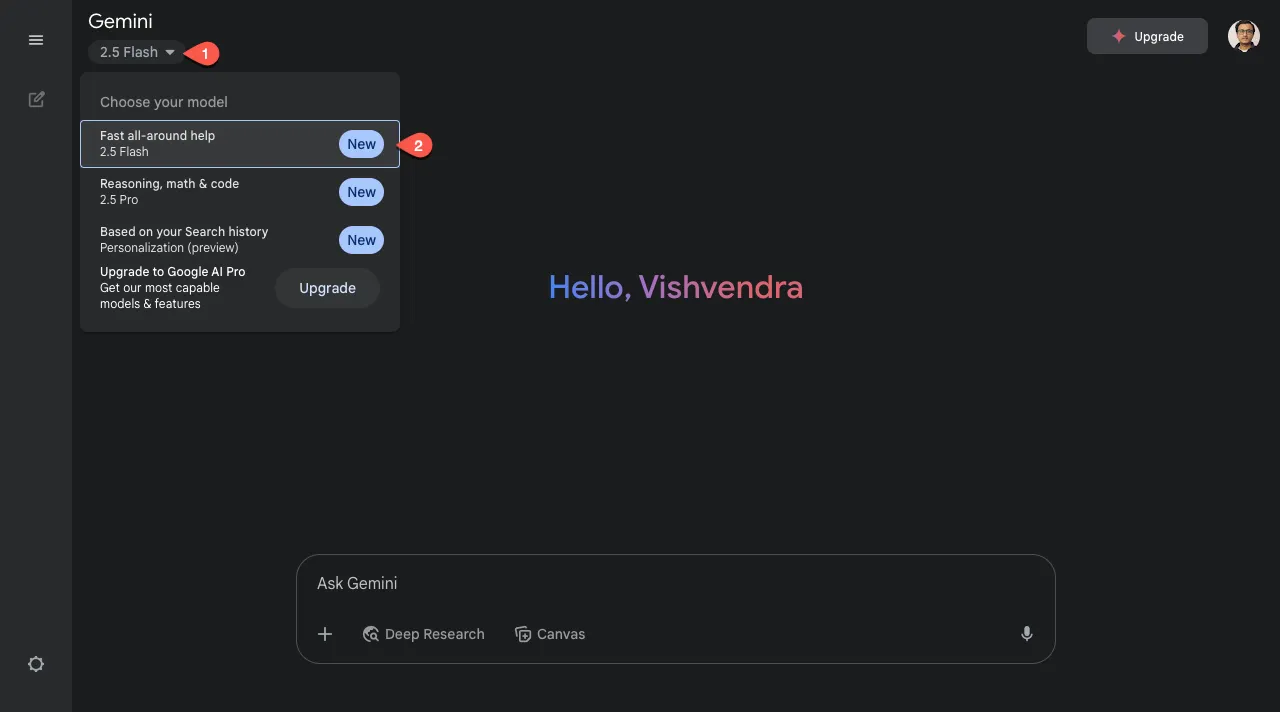
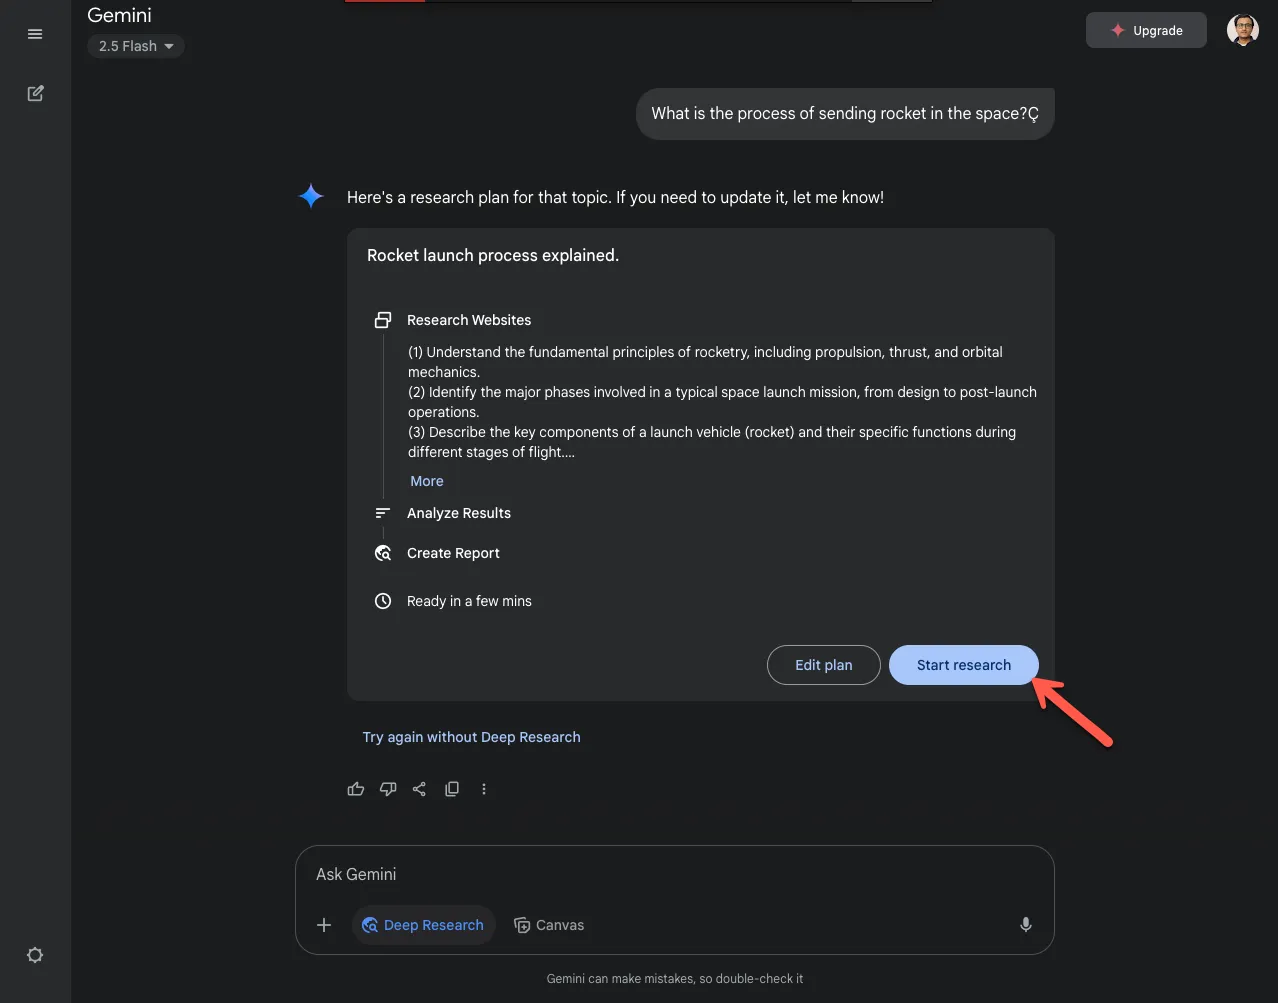
So, how can you do it? First, open the Gemini App, and ensure that it’s set to 2.5 Flash.
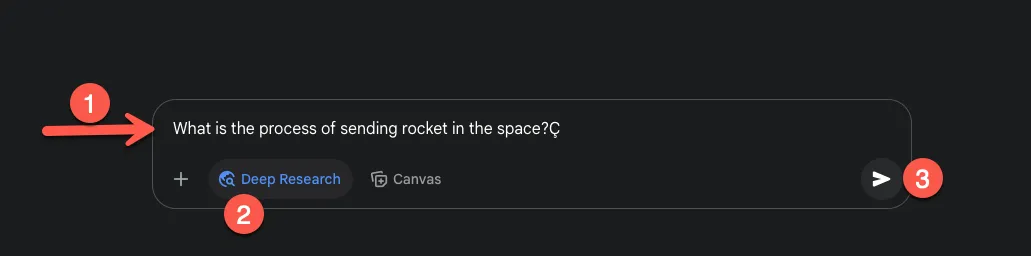
Then, in the chat field, ask Gemini a question related to your infographic, or provide it with the information. Select the “Deep Research” option, and then click the “Submit” icon.
This will create a research plan in a moment. Click on the Start research button to initiate it.
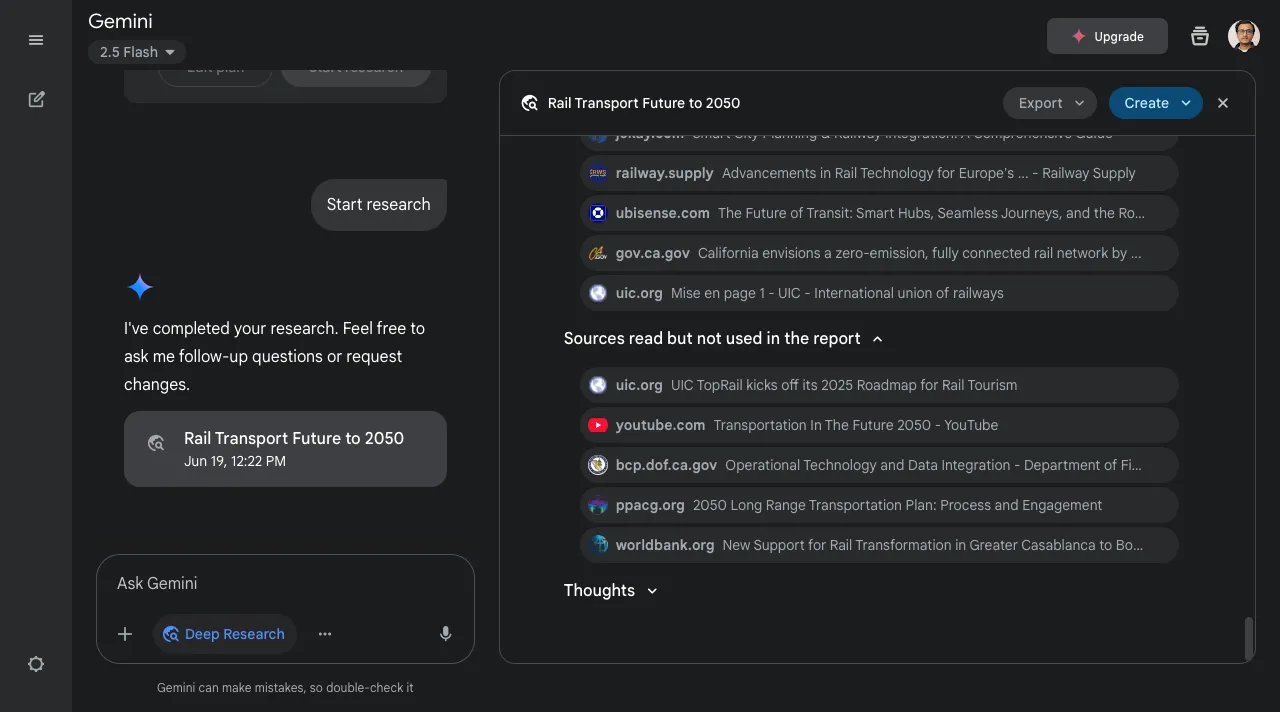
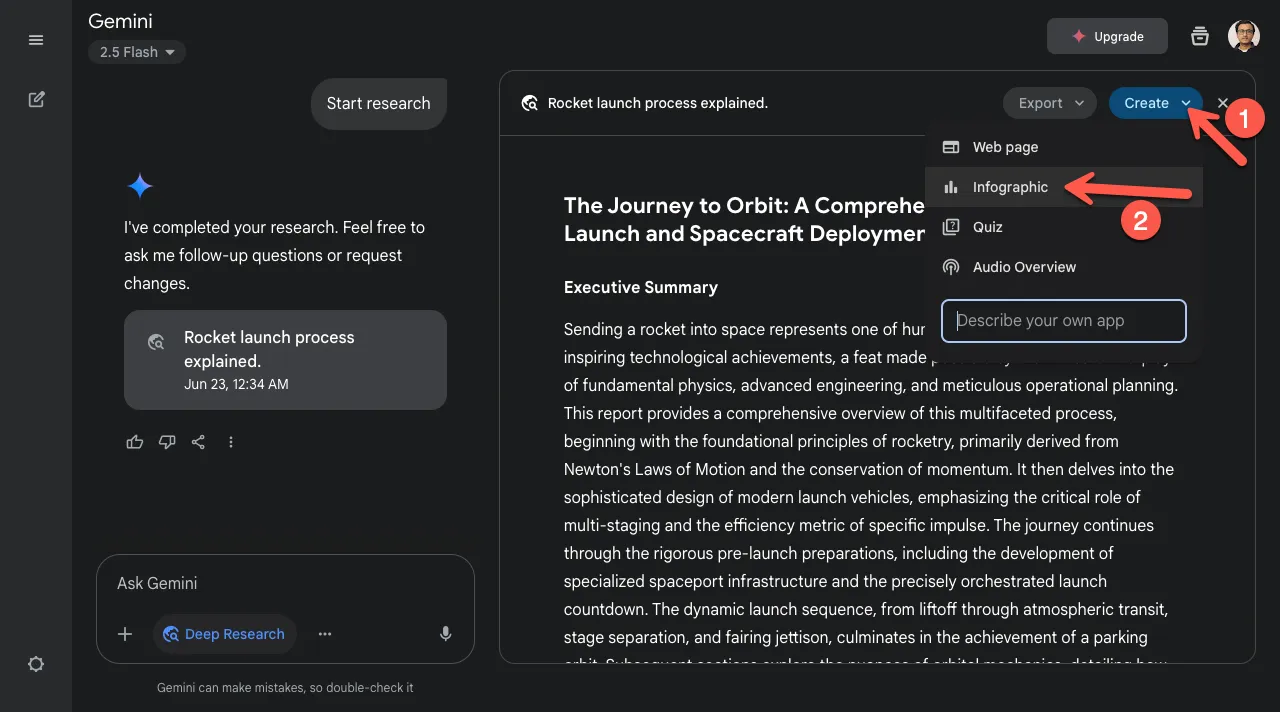
As you click, it will open Canvas and begin its research. Once the research is complete, you will receive the report and options to turn it into an infographic. To access, go to Create → select Infographic.
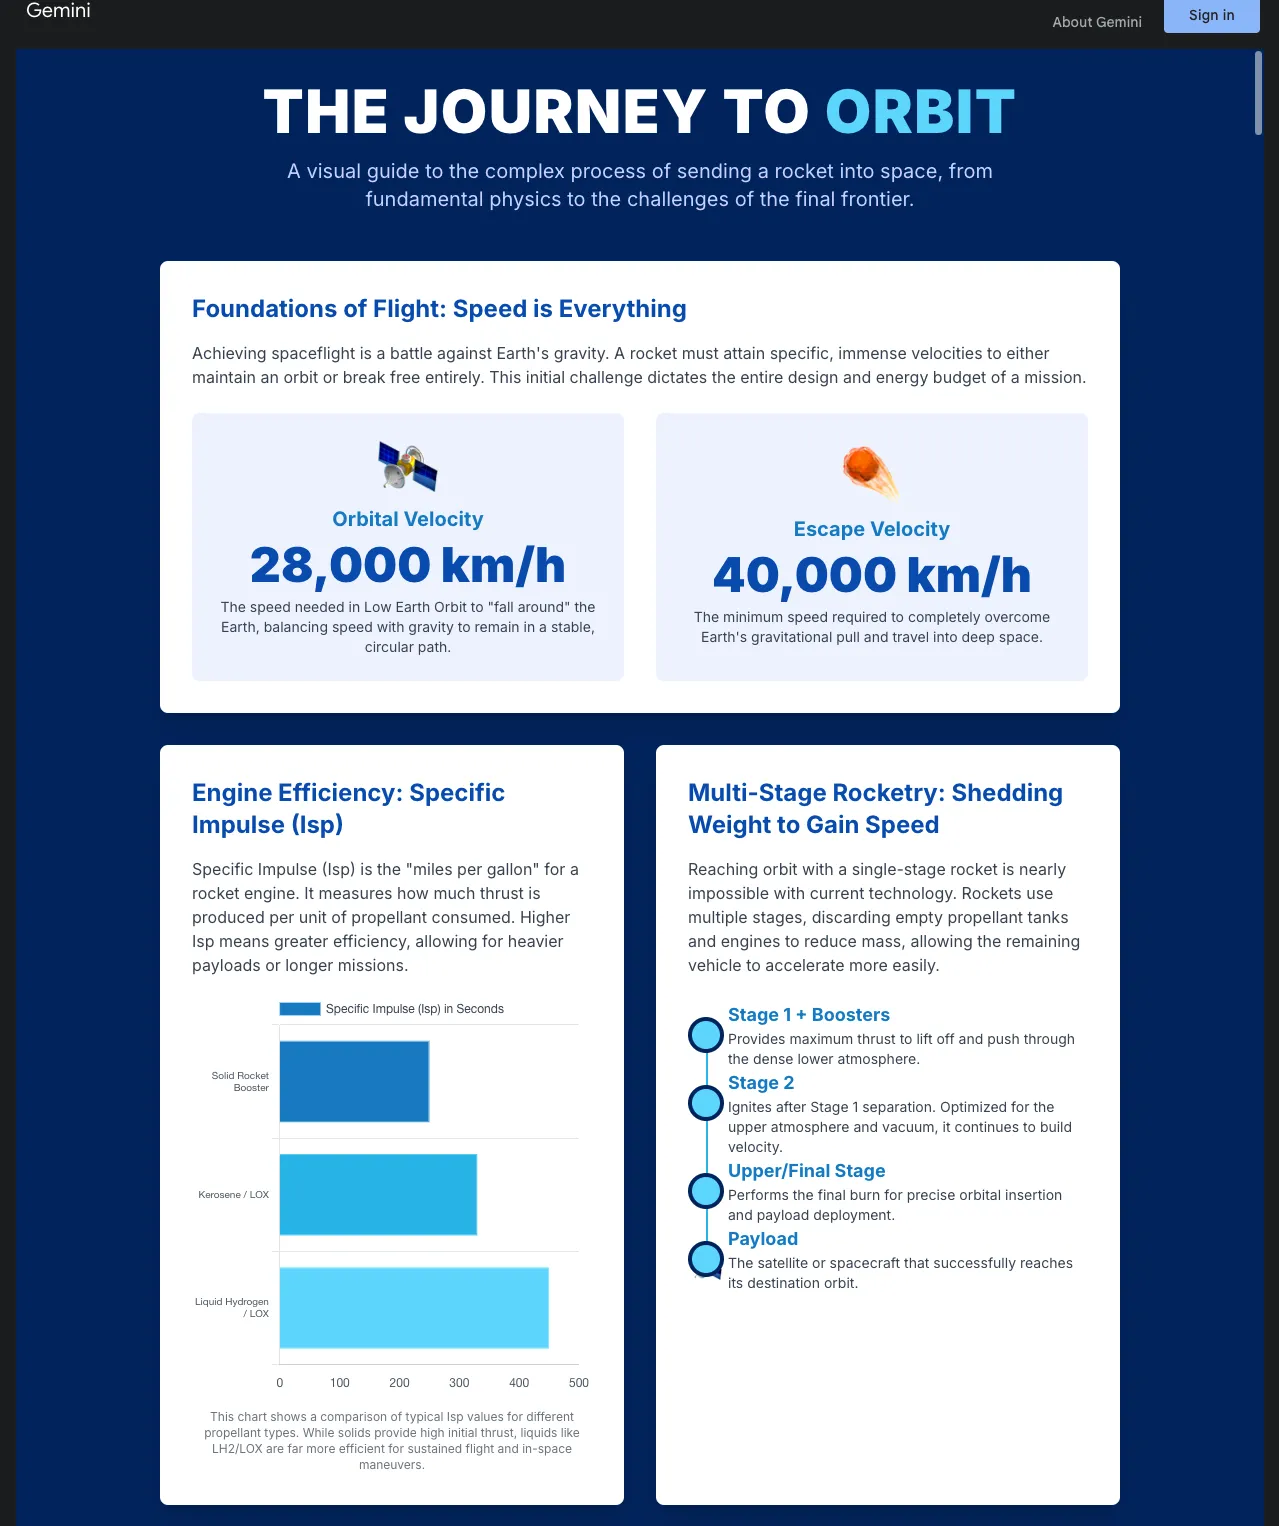
This will start another process to turn the data into an interactive infographic, and soon you will get a code for your infographic, like the following:
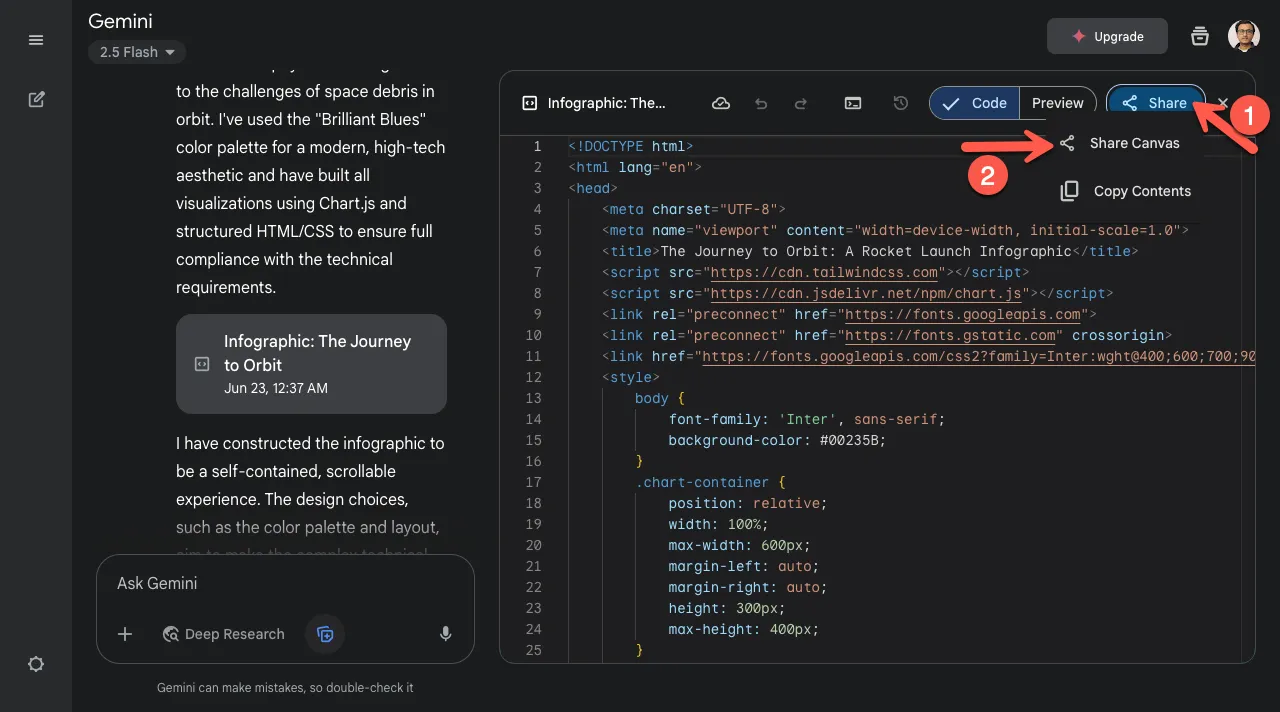
You can use this code on your website to display users’ interactive infographics, something they can really interact with. However, if you need to use it as a graphic, click Share.
Then select Share Canvas.
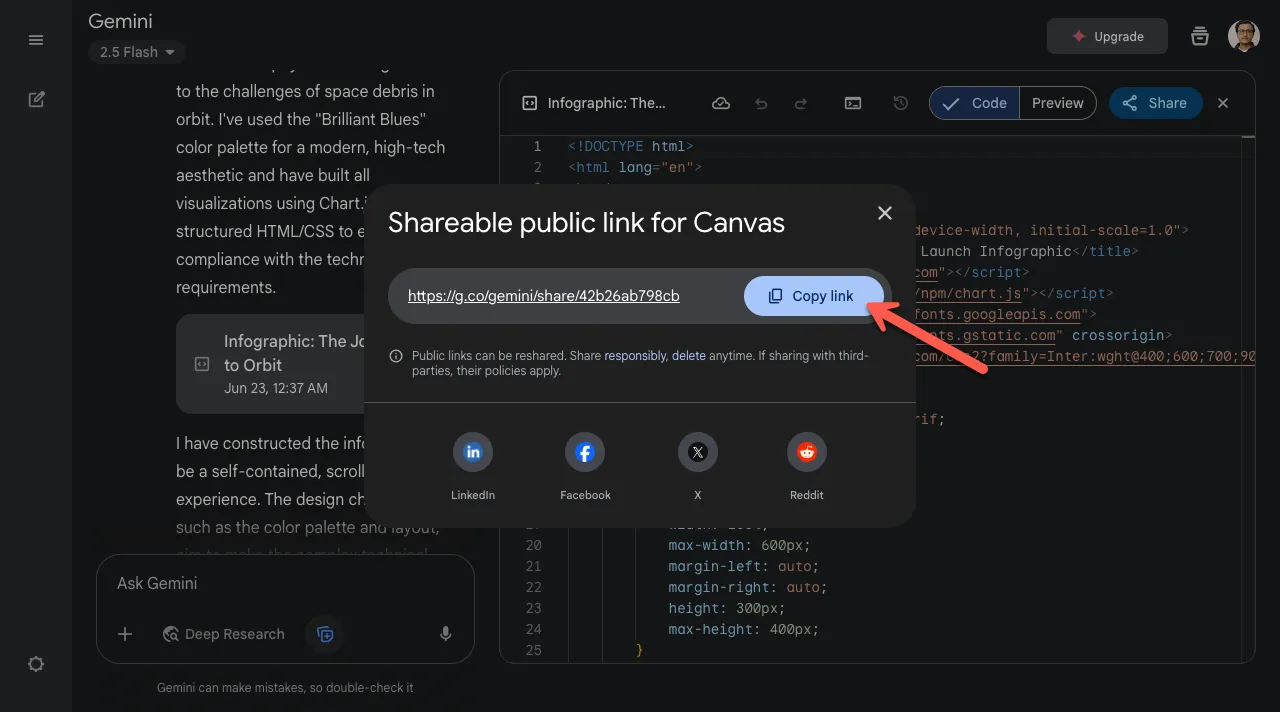
A pop-up will appear, and you can copy the infographic link to paste in a new tab.
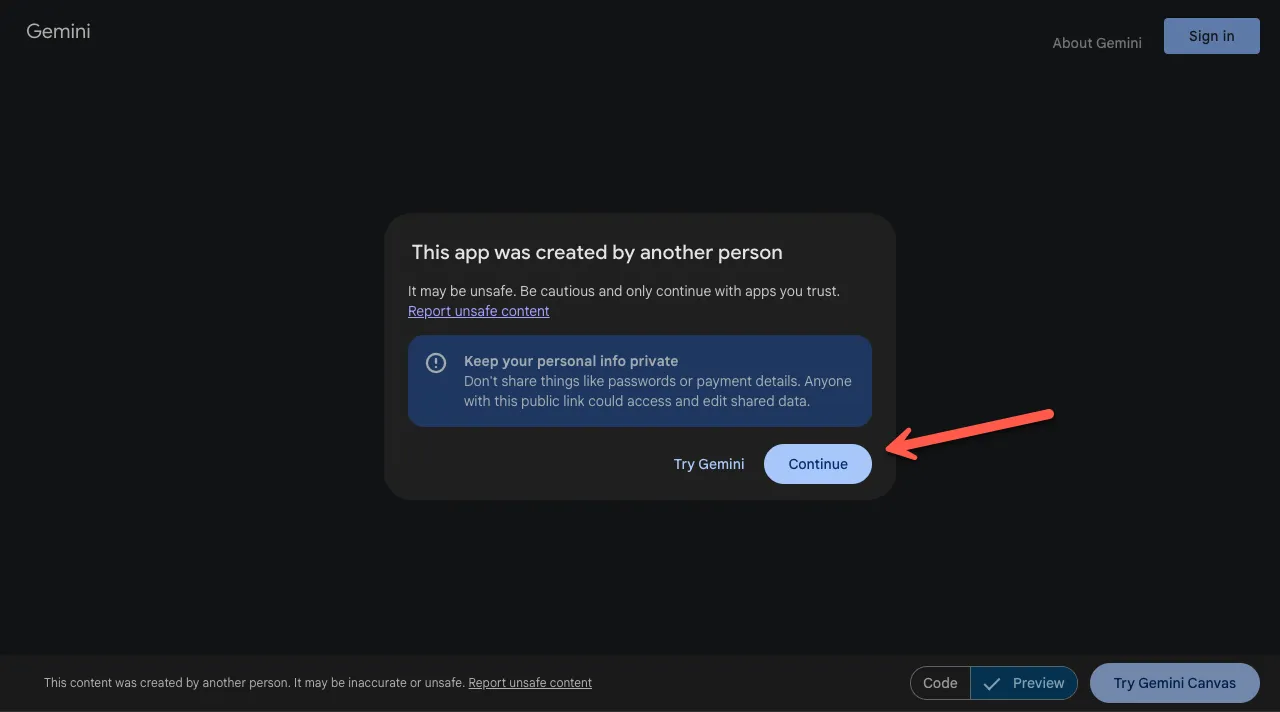
When you do so, you get a preview of your infographic. A pop-up will appear; select Continue.
Now, explore your infographic as you like, and to turn it into an image, simply use a screenshot tool to capture it.
Why Use the Deep Research Method?
You can create infographics with Gemini AI by directly accessing the Canvas option and specifying your requirements. However, I used the Deep Research method to gather more information because, in that way, you will be able to create a highly informative and interactive infographic.
Go to Gemini → Select Canvas → share your infographic details.
It will then generate the code, which you can edit to customize the infographic according to your specific requirements.
2. Use Napkin AI to Create Infographics from Pre-built Templates
Napkin.AI is a new tool that lets you create creative, engaging infographics.
Not infographics in particular, but rather diagrams, mind maps, flowcharts, data charts, and so on.
Napkin AI works by using thousands of pre-built styles stored in its database to visualize the information you provide. You can select the design you like the most, then make changes using its highly customizable editor.
The Napkin AI editor lets you:
- Make changes to the infographic’s layout.
- Use a different font family for the text.
- Add appropriate icons.
- Apply different color schemes to the infographic’s elements.
Likewise, there are other options you can utilize to make your infographic engaging using the Napkin AI’s visual editor.
How to Create Infographics With Napkin AI
To create your infographic with AI using Napkin, you need to first visit Napkin AI’s official website. Click on ‘Get Napkin Free’ and create your account.
Then, follow the simple onboarding process, and once you’re done with that, you will get the following screen:
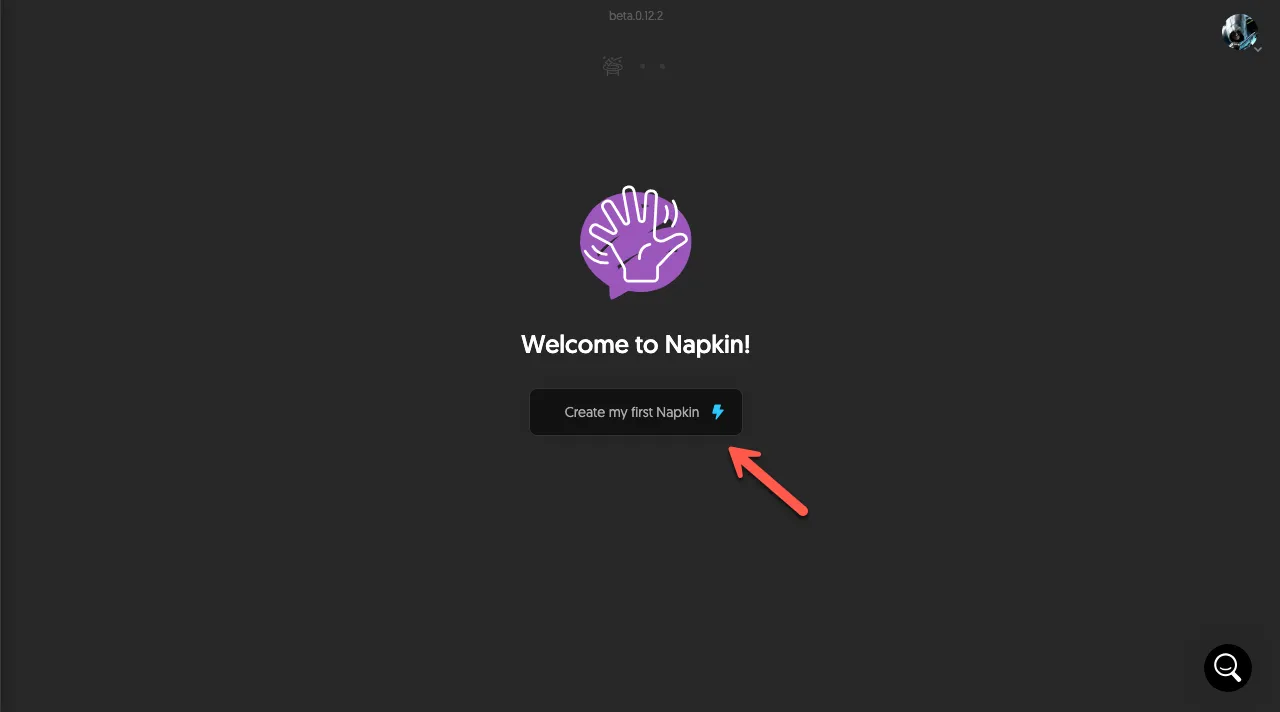
Now, to create your engaging infographic, click Create my first Napkin. This will open further options for how to create your generative AI infographic:
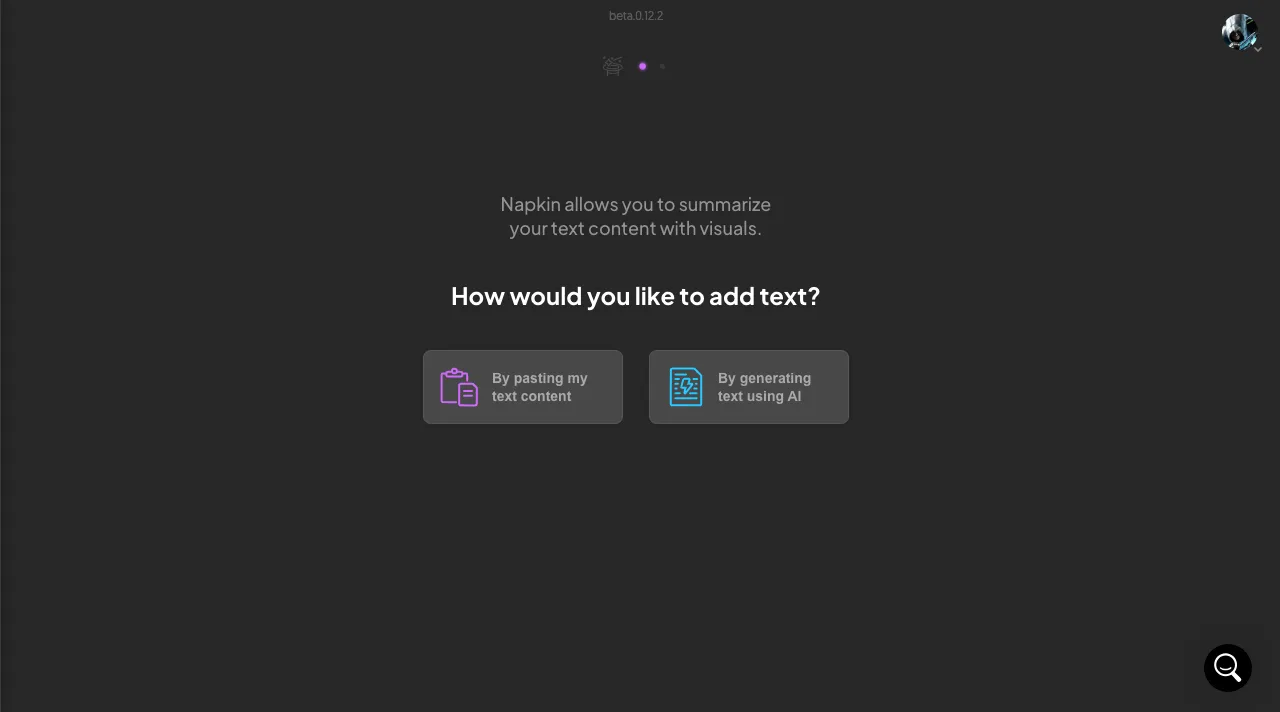
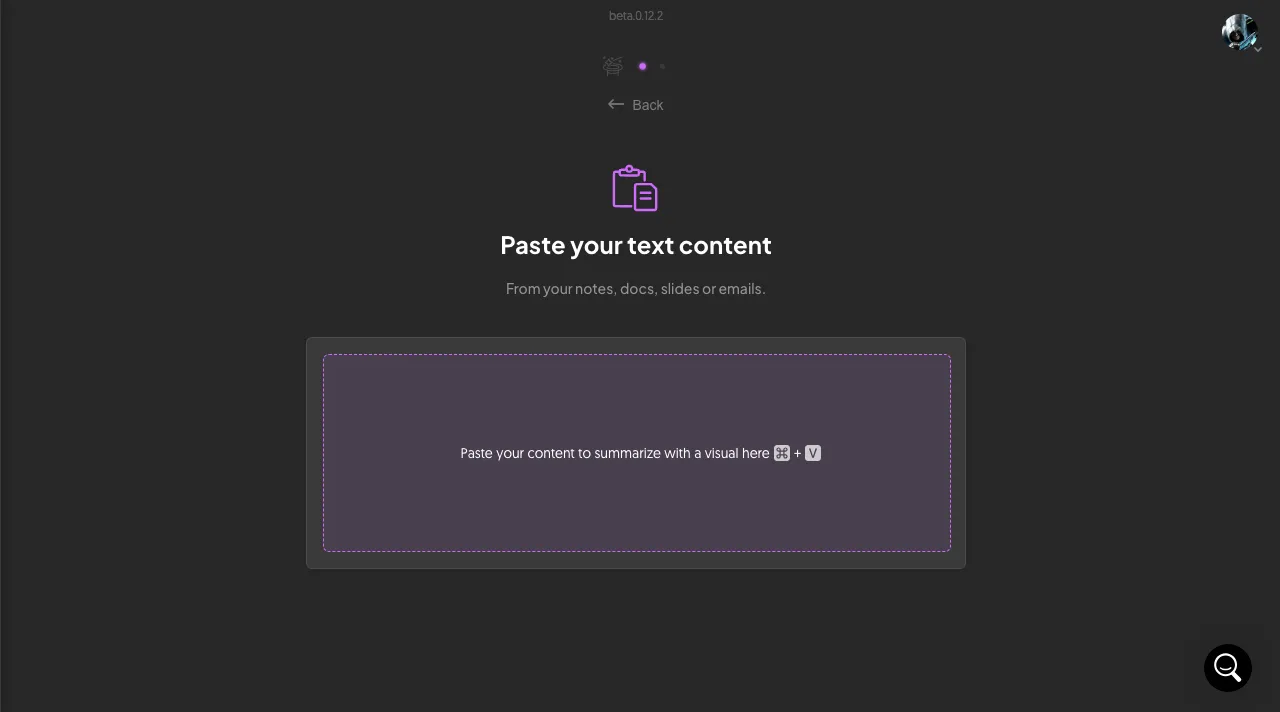
- By pasting my text content
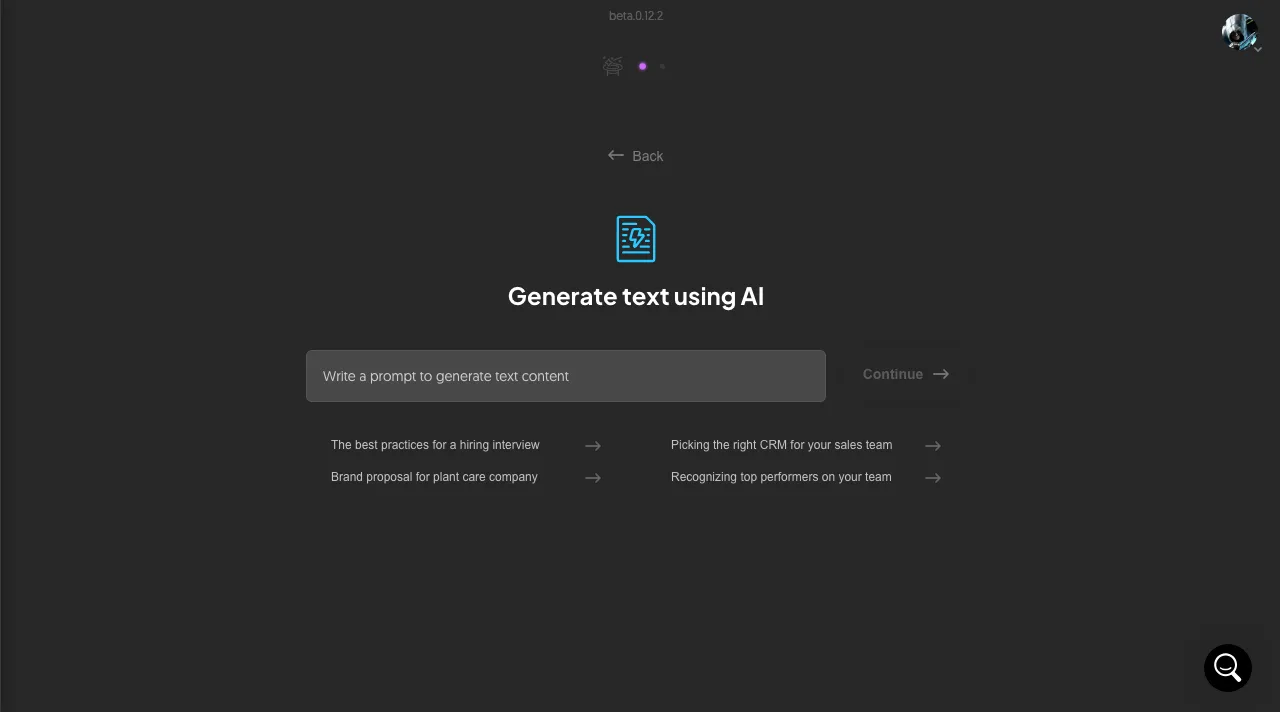
- By generating text using AI
If you select the first option, you get a text field like the following:
If you select the second one, you get a field to write your prompt, along with a few examples.
Now, whatever option you choose, you’ll be directed to the following editor.
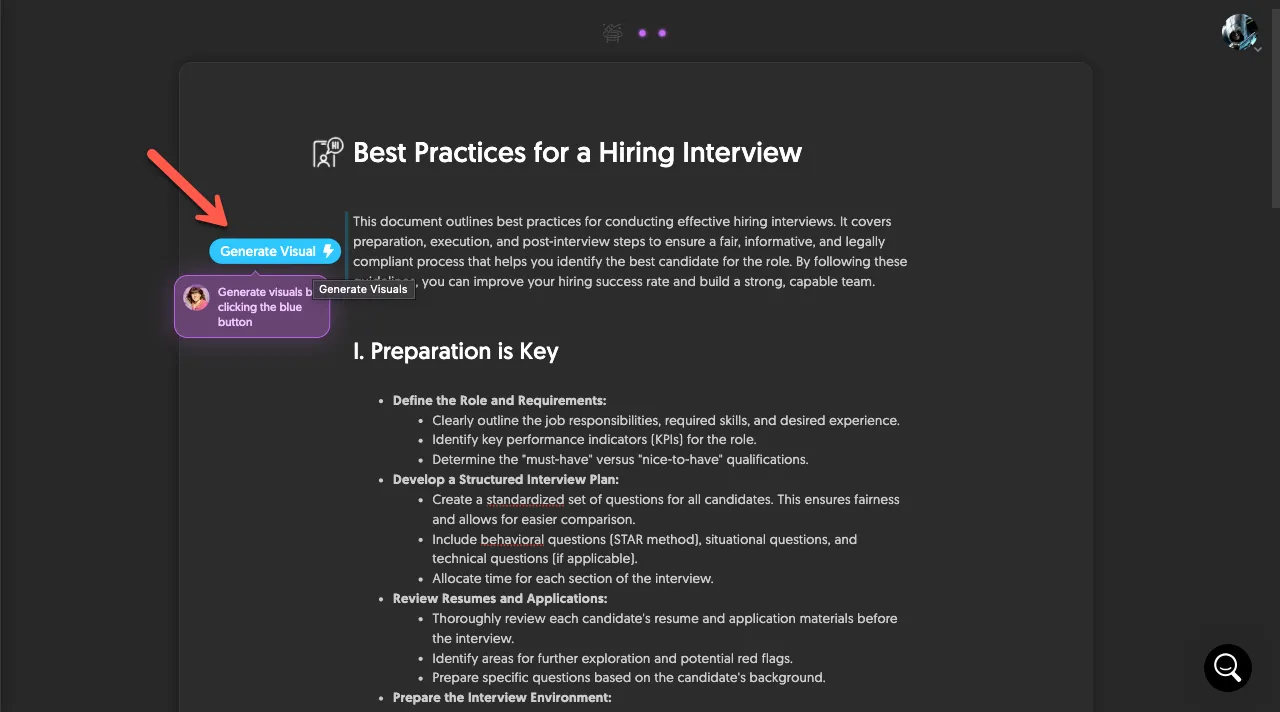
Here, to generate the infographic, select the text and click the Flash icon.
It will take a few moments to generate multiple designs of your infographic. Once done, you can see the variation of a single infographic into multiple infographics. Now, you need to select the one that suits you best.
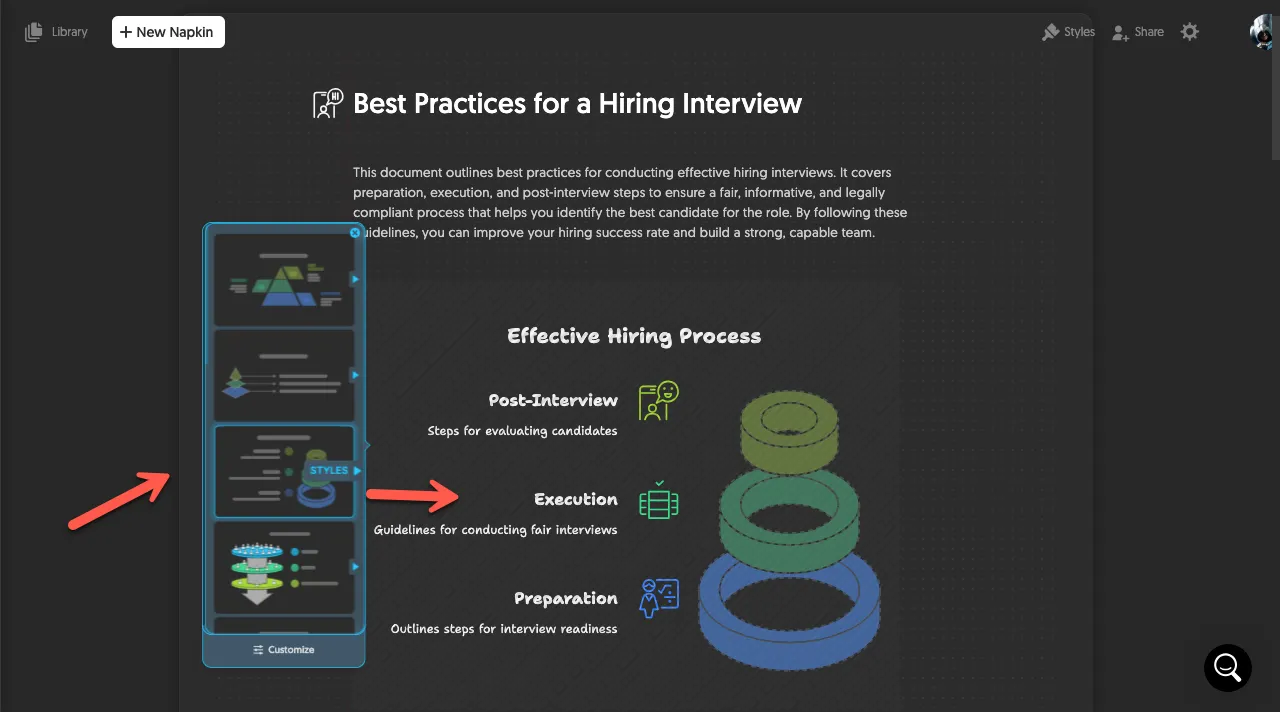
When you click on the infographic, you get the tooltips to customize the elements.
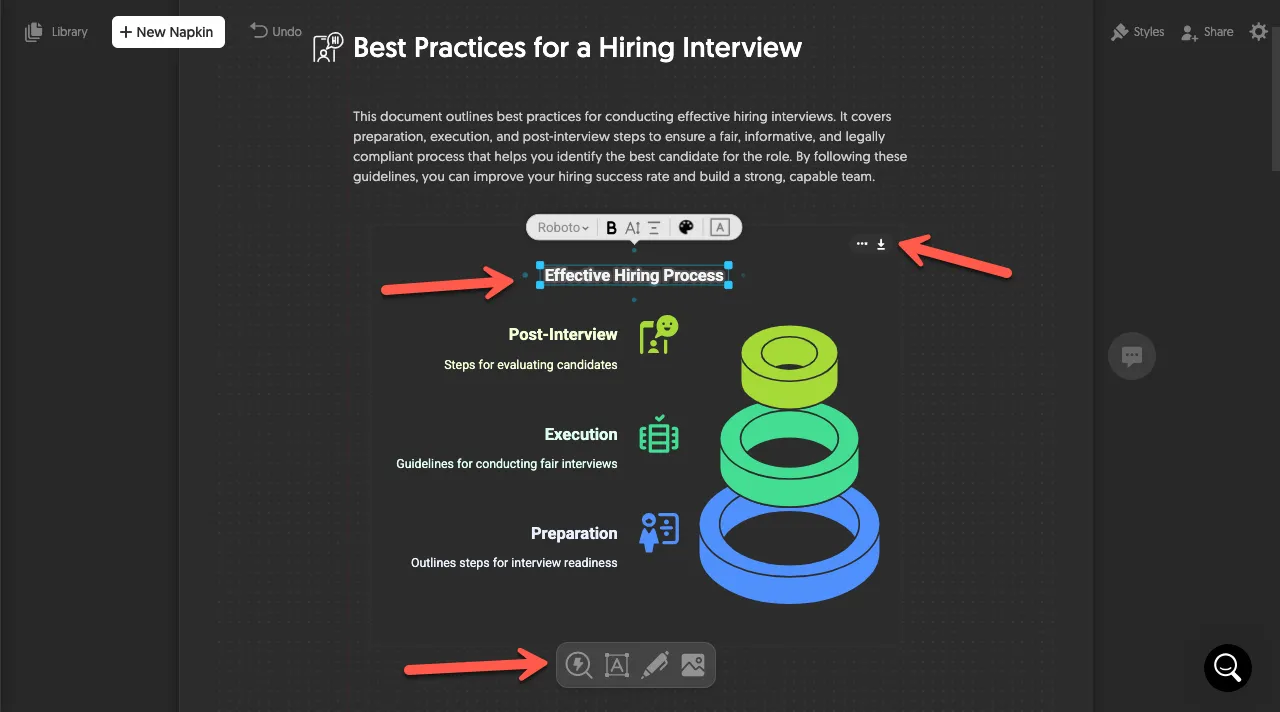
To export your infographic, you need to click on the export button.
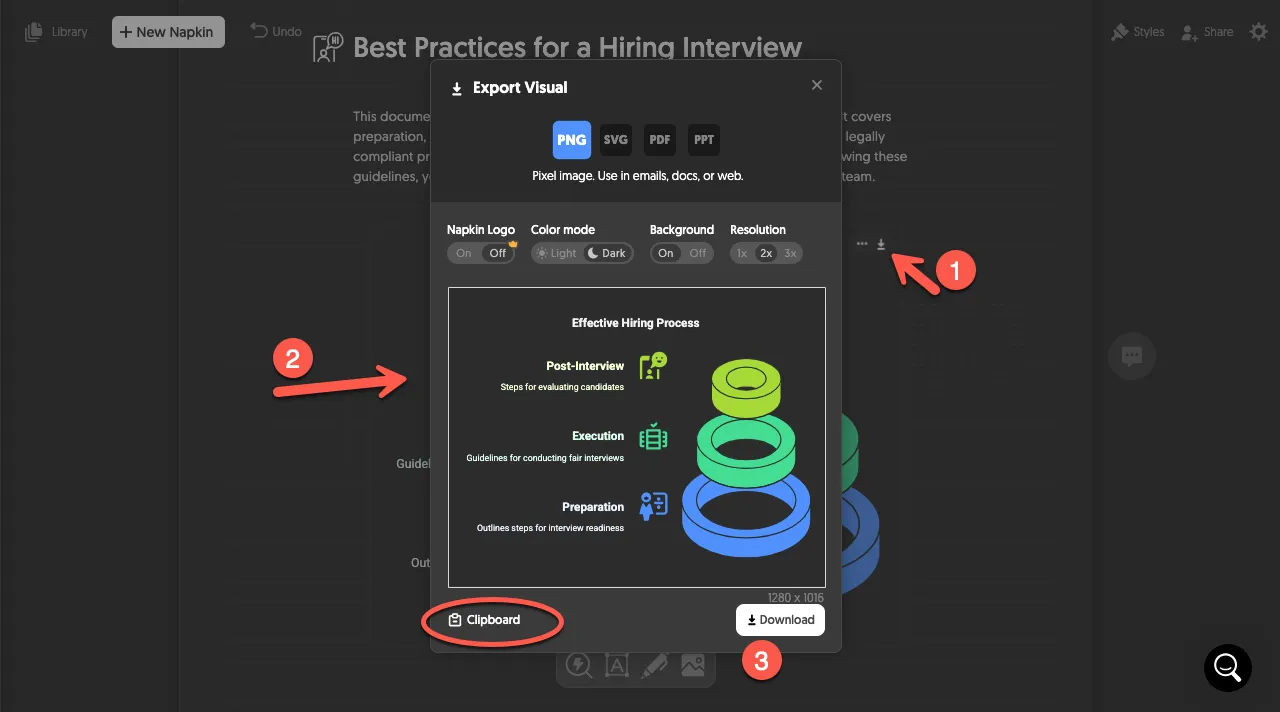
You further get options to export the visual as:
- SVG
- PNG
- PPT
Plus, you can select whether to display Napkin’s logo, use dark colors, background, and its resolution.
Simply select your options, then click the Clipboard button or Download.
3. Combine Sora and Canva for AI-Human Infographics
If you are thinking of creating infographics using ChatGPT, then Sora is your answer.
However, in order to create highly engaging ChatGPT infographics, you need to be good at prompt engineering, just like the case of ChatGPT captions for Instagram. A simple conversation won’t let you create professional, clear infographics with ChatGPT or Sora.
But to overcome this situation, you can use Canva as well.
In most cases, when you try to create an infographic in Sora, it will produce a good design. But you will find mistakes in the grammar, and some elements will appear wrong.
Therefore, to create ChatGPT infographics, take the idea from the infographic Sora generates and manually create it in Canva. You’ll have a great AI-human combination that will deliver outstanding results.
If you try to create infographics using Sora alone, you need to be good at prompt engineering; otherwise, the result won’t be desired.
Thus, use the ChatGPT infographic to get an idea, then create it by hand in Canva.
This also allows you to improve the idea, because that’s what happens when the human mind starts working on something. It always comes out something better.
How to Create Infographics With Sora and Canva
Go to Sora, and write your prompt.
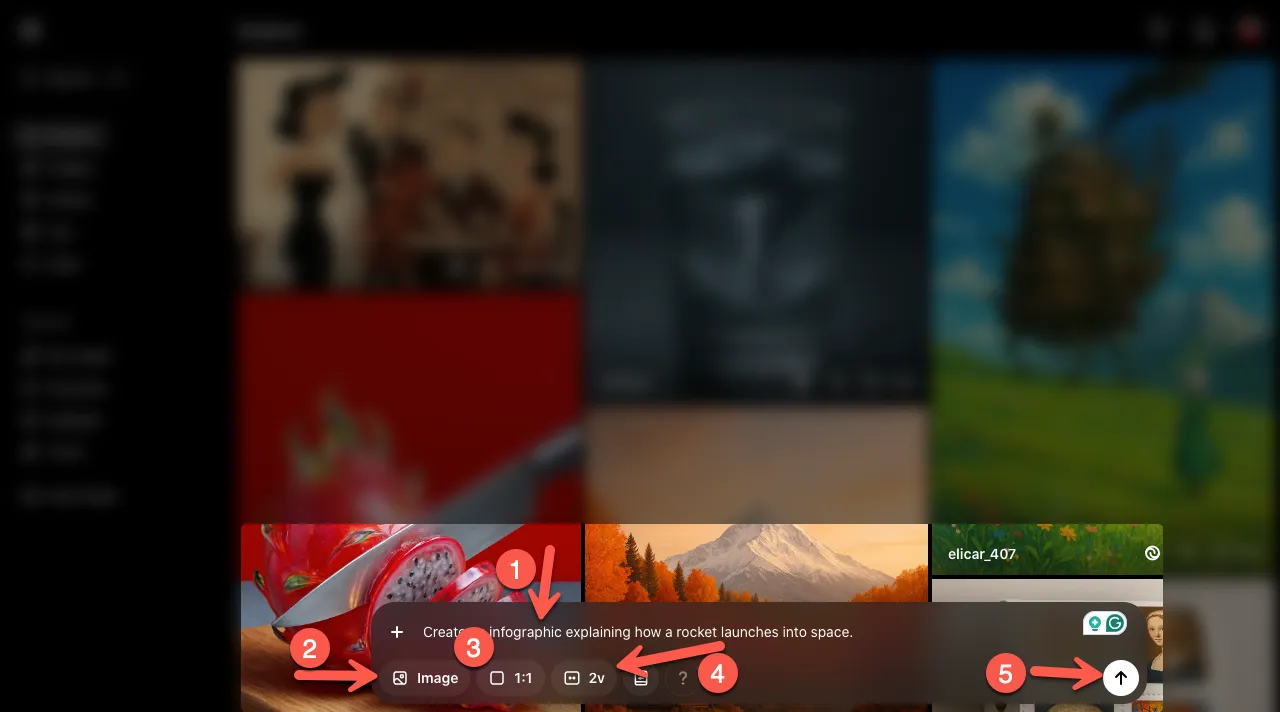
Select the image, two variations (it generates better results because more cores are working on fewer projects), and the dimension, then submit. It will take a few minutes to generate your infographic. Once it has created the infographic, open Canva.
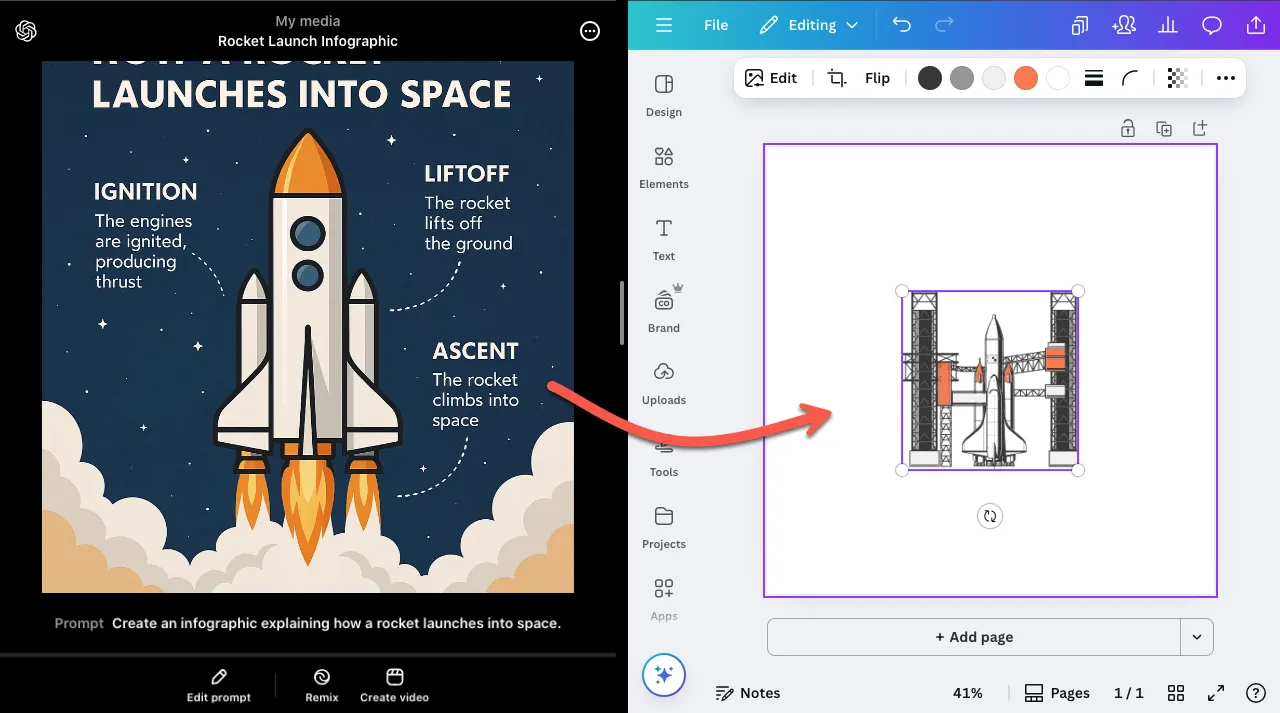
Take the idea from Sora’s infographic and use Canva tools to create your own.
How to Create Infographics With Canva AI Alone
If you don’t want to use Sora for generative AI infographics, then you can also use Canva alone to do it. Since the launch of Canva AI, you can now use it to create minimalist and up-to-date AI infographics.
So, how can you do that?
Open Canva, then on the homepage, click Canva AI.
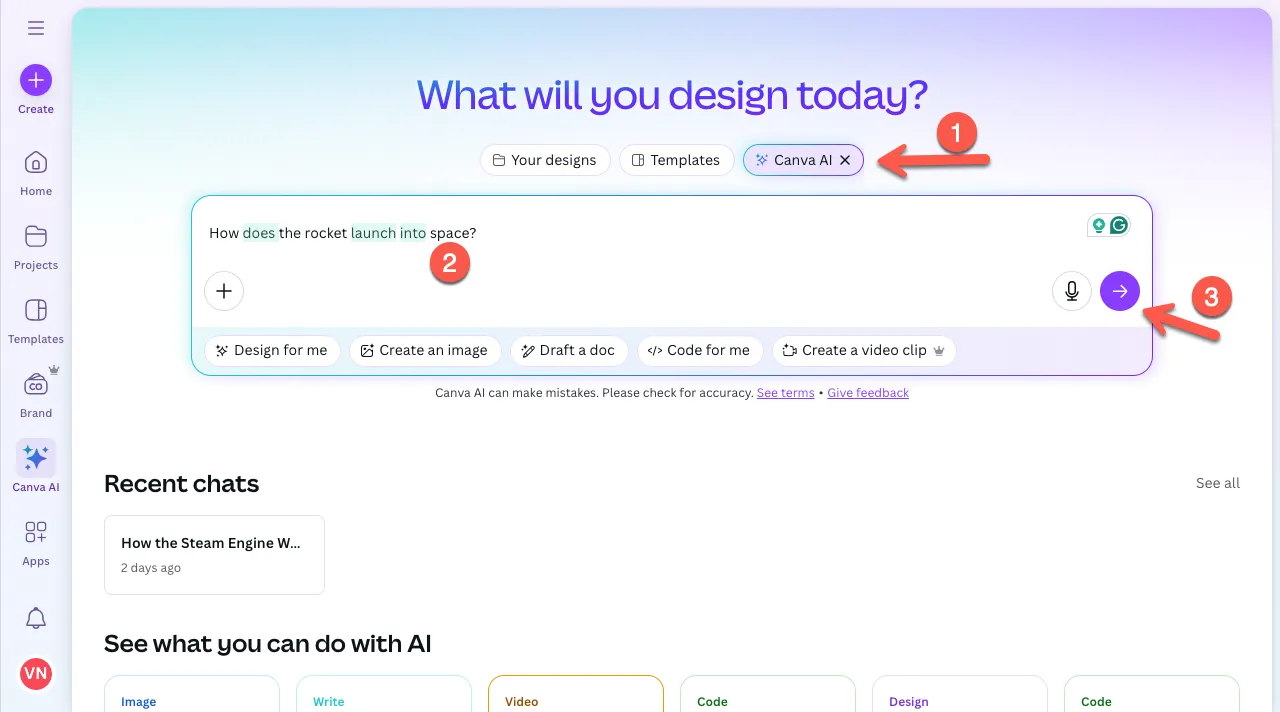
Enter the details of the infographic you want to create, and then submit. It will take a few moments, and your infographic will be generated.
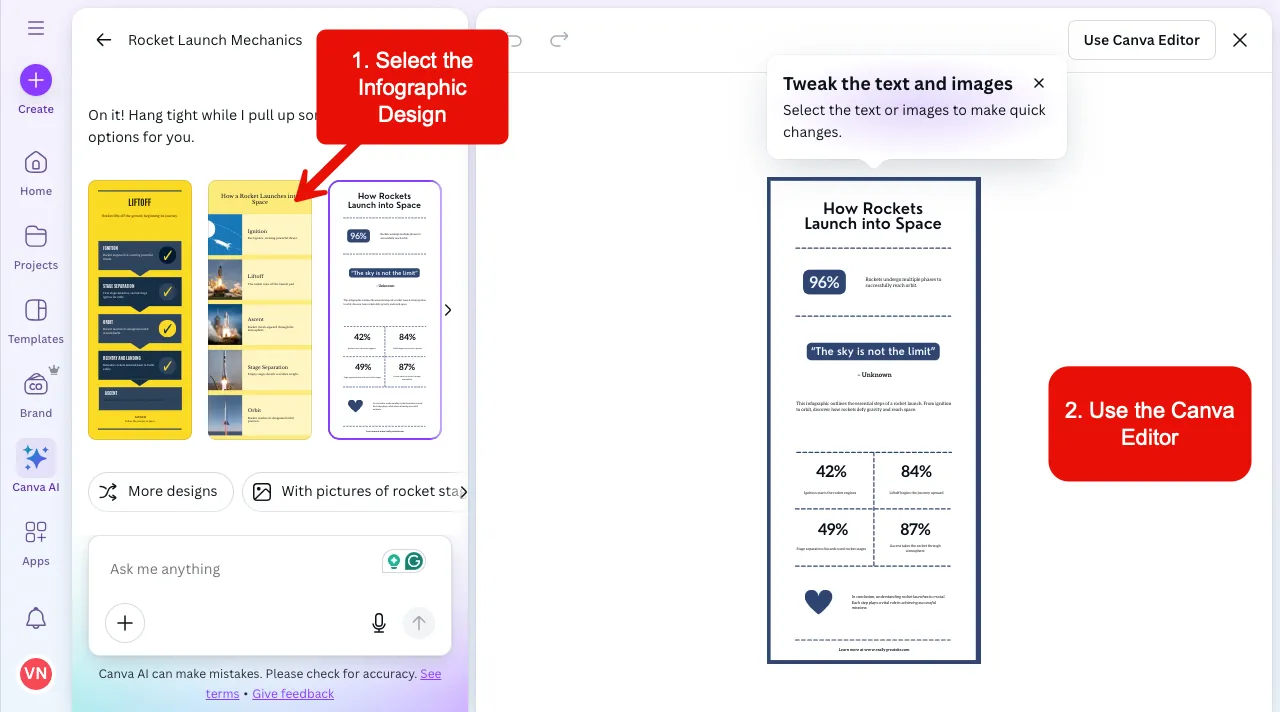
The good thing about Canva AI infographics is that it doesn’t give you an image of the infographic. Instead, it provides an edible infographic, which you can edit right in the Canva editor.
Make your changes, then export them.
4. Run Gamma AI for Fast and Professional Infographics and Presentations
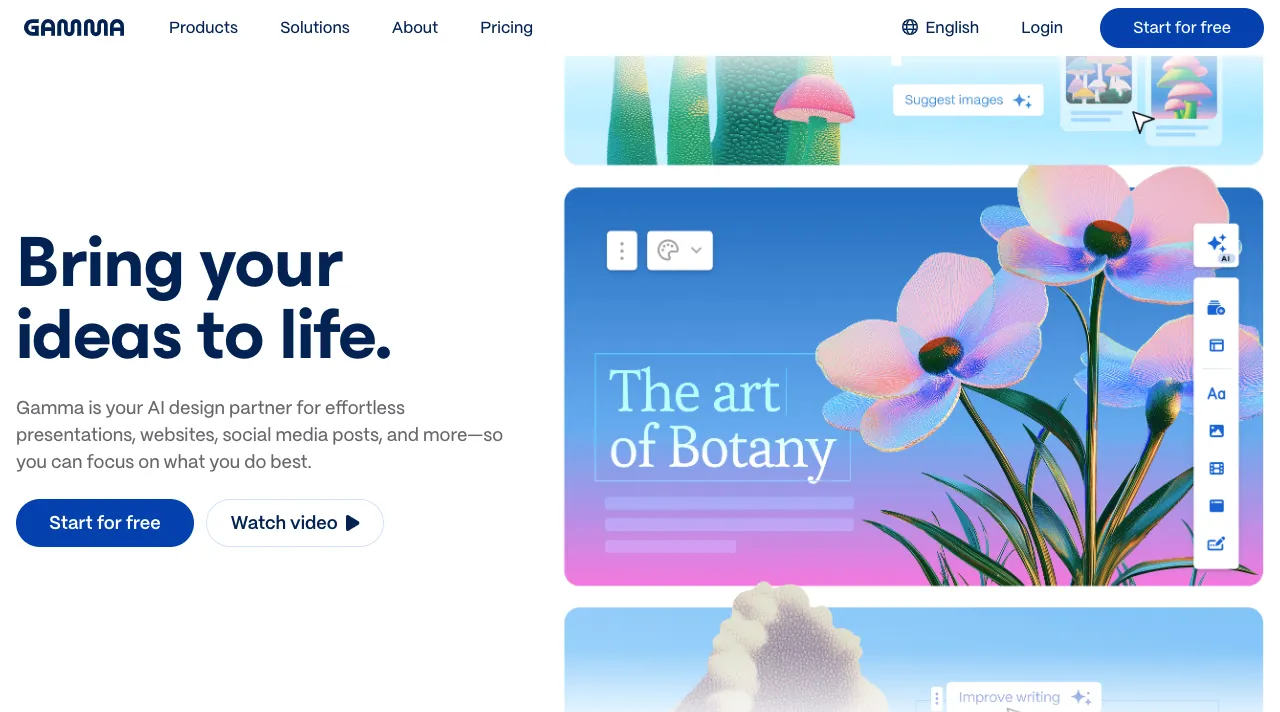
Gamma AI is popular for creating highly informative presentations with simple prompting. You don’t have to be a pro at writing prompts. You simply have to share your idea, and it will quickly generate an engaging, element-rich, platform-suitable infographic.
If you’ve got a whole document, you can also use that, and it will generate the infographic based on that.
Yes, it’s popular for lightning-fast creative presentations, but you can use those presentations as infographics for your documents, social media like LinkedIn or Instagram Carousel, and website as well.
It provides a super user-friendly interface that lets you generate, edit, and export your best AI-generated infographics in no time.
What’s more interesting with Gamma AI is that it provides you with multiple pre-built templates, inspiration designs, themes, custom fonts, and AI images. You can also create websites using Gamma and manage your creative works in dedicated folders.
Thus, all these features make Gamma one of the Best AI Infographic Generators for 2026.
How to Create Infographics With Gamma
To create your infographic using Gamma, first visit its official website and then create your account.
After creating your account, you will be presented with the onboarding process. Simply complete it, and then find yourself with the following options:
- Paste in text.
- Generate
- Import file or URL
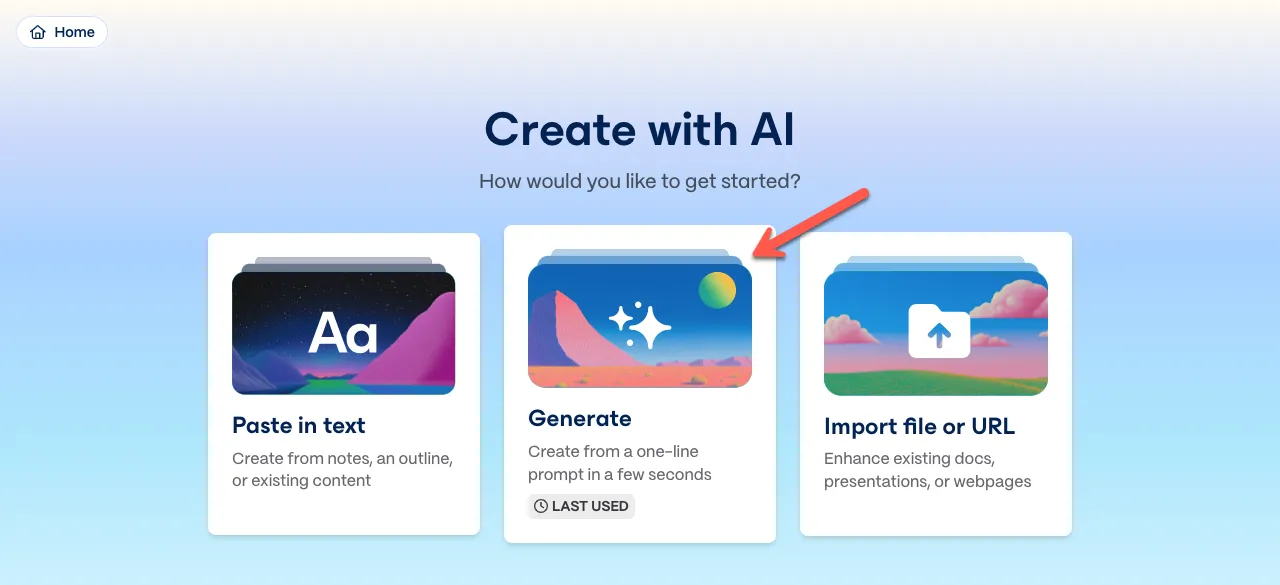
Select Generate, and you need to further provide a prompt with options to create your visual content for Presentation, Webpage, Document, or Social.
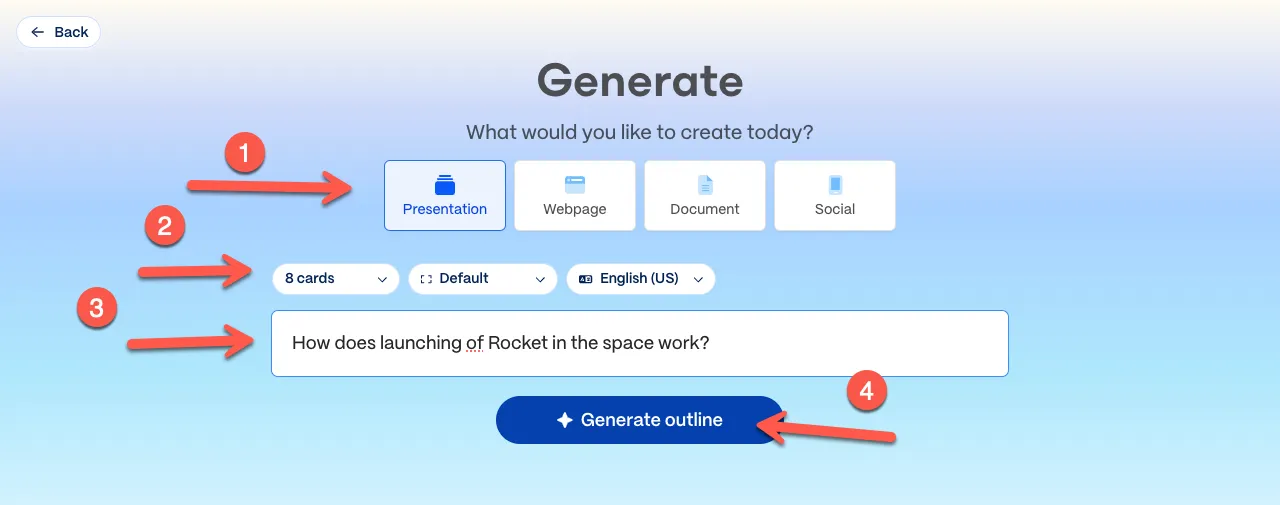
You can also select how many slides you need, what layout it should be, and the language. Simply, add the prompt, make your visual configuration, and click on Generate outline.
As you click that, you will get the following interface with content and theme.
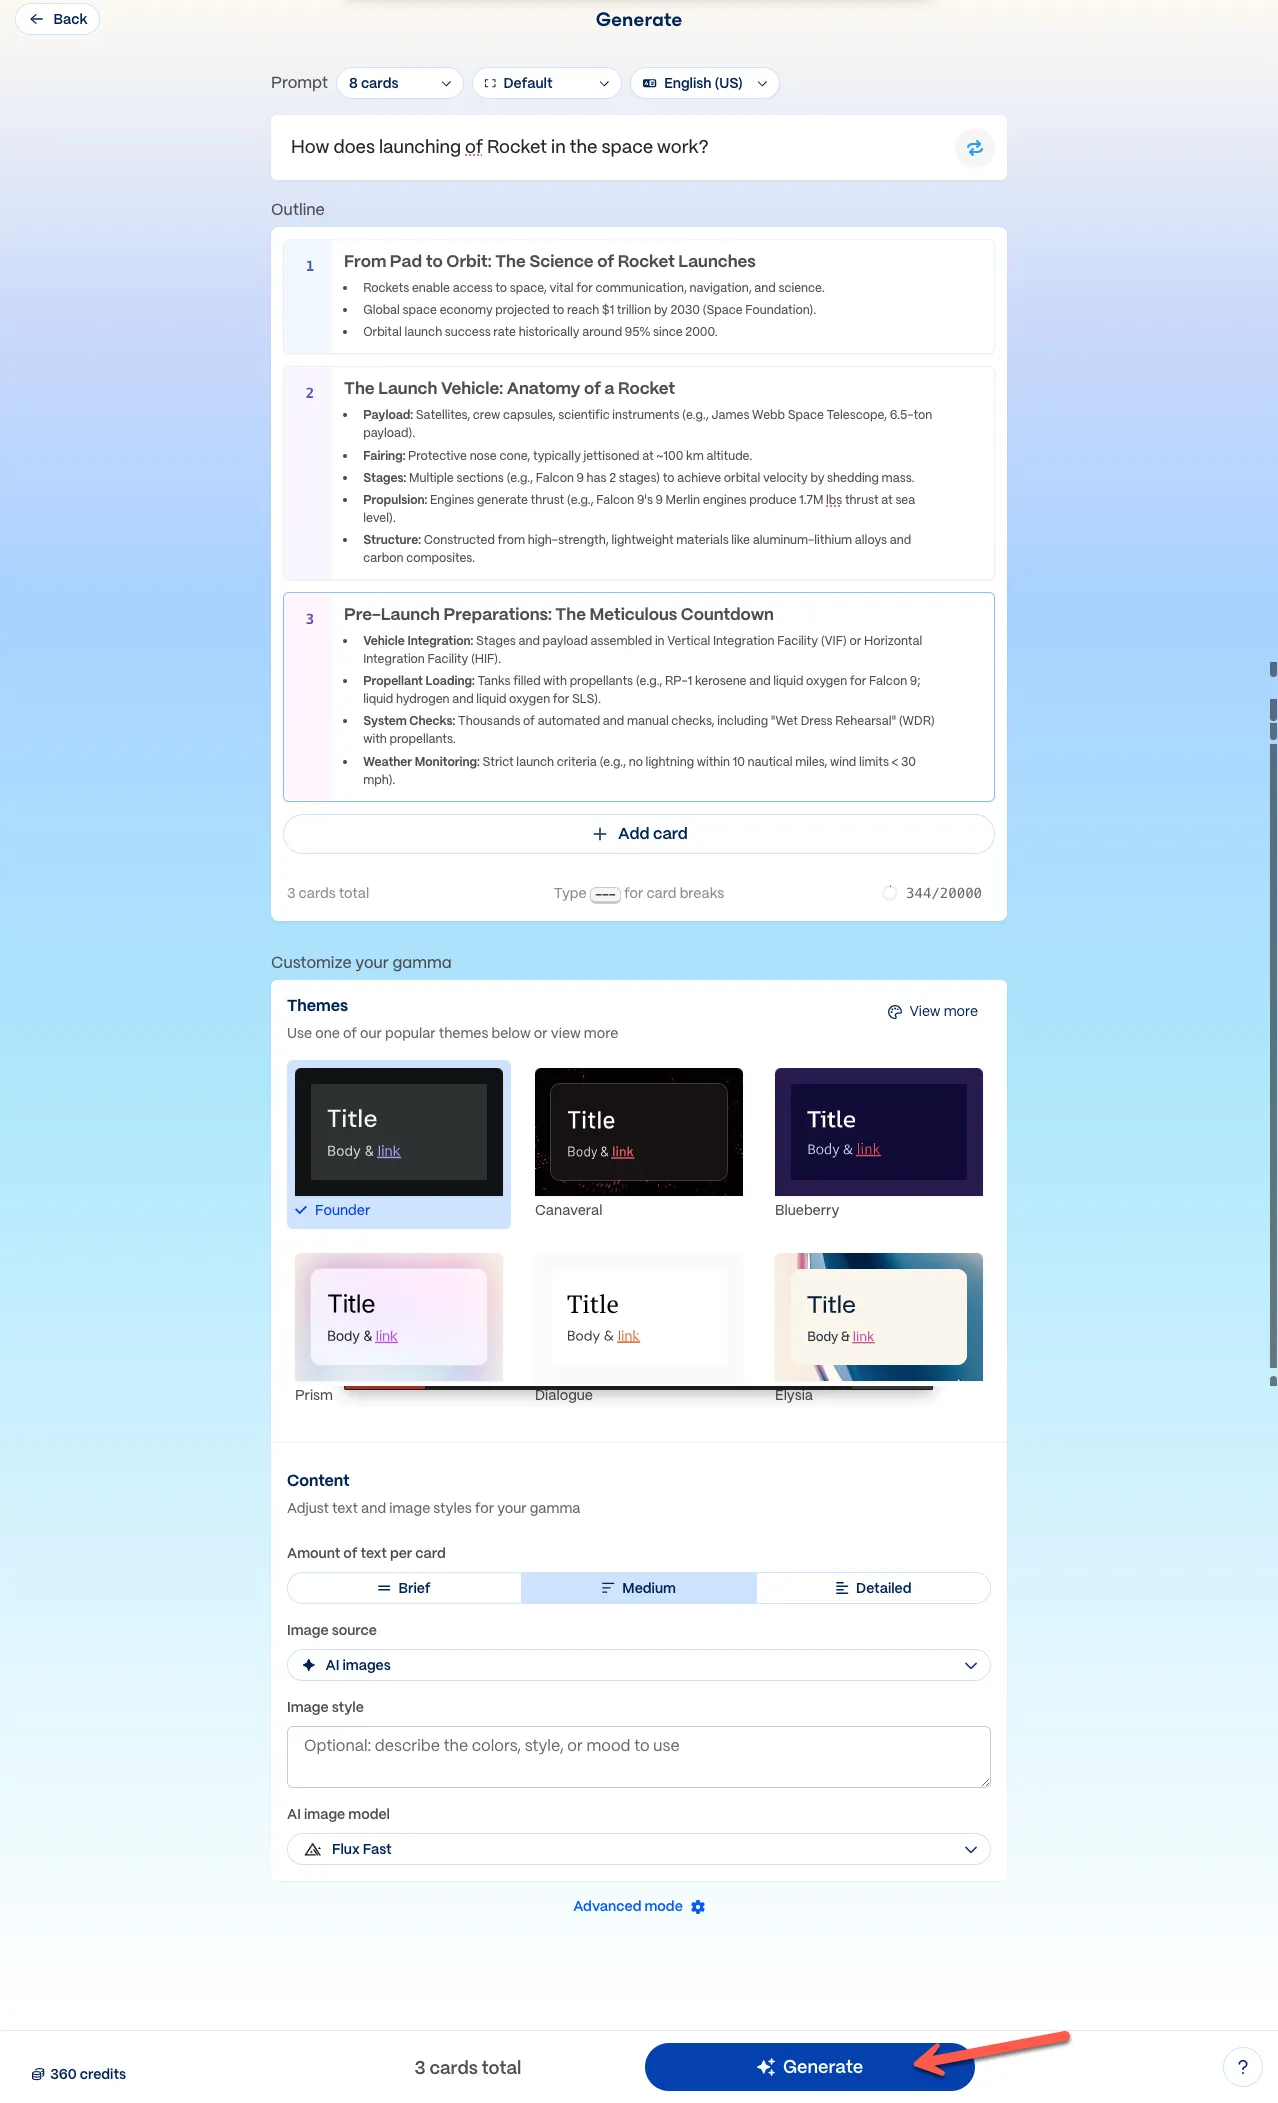
Edit the content, select the theme, and make other configurations. Once done, click Generate.
As you click it, the Gamma AI will start creating your infographic inside the editor like the following:
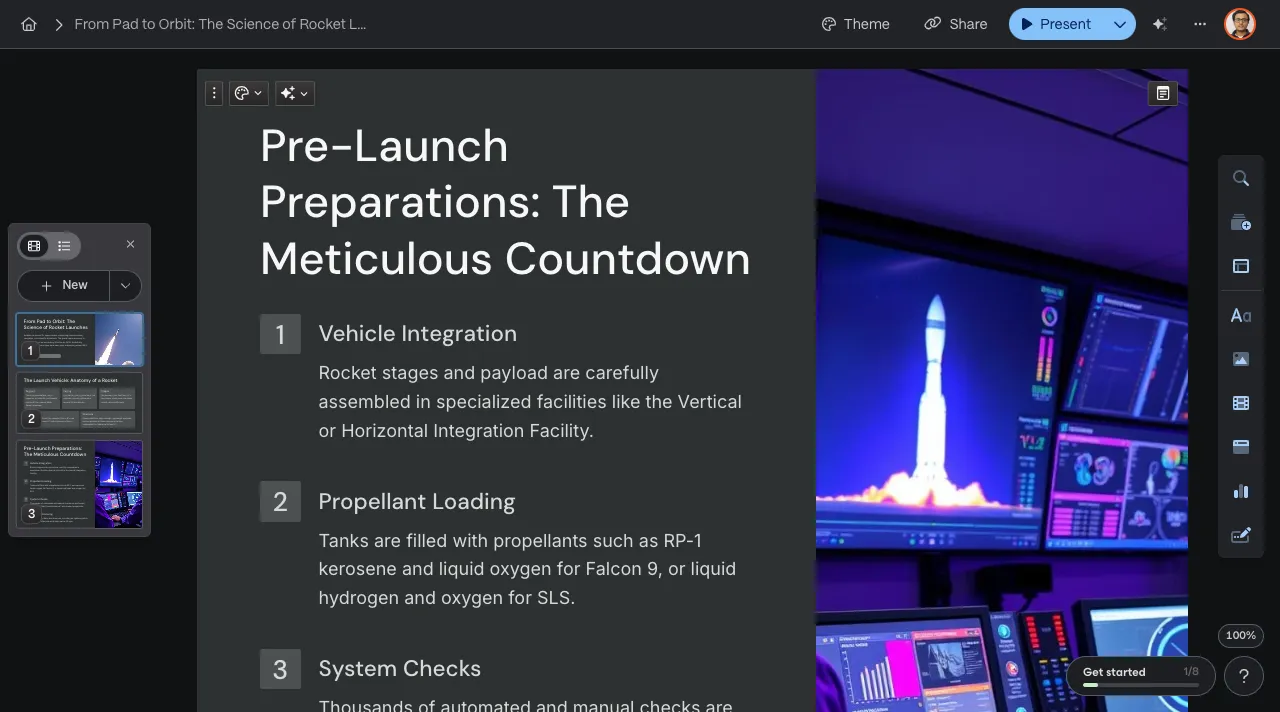
It provides you with all the tools to customize the content. Simply utilize them, and once you are done, click on the options (…), then choose Export, and download the infographic per your requirement.
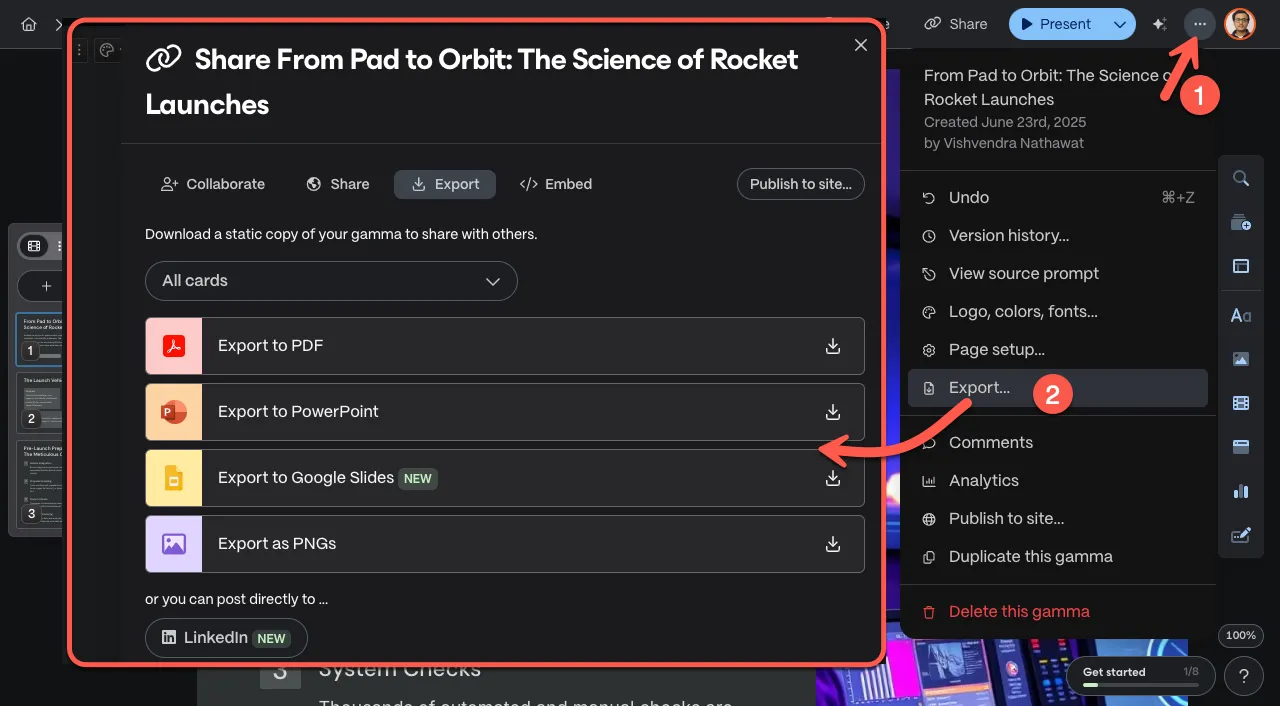
The Gamma AI lets you download your visual content in multiple formats. You can even upload it on LinkedIn with a simple click.
However, you feel right, just get the infographic in that way.
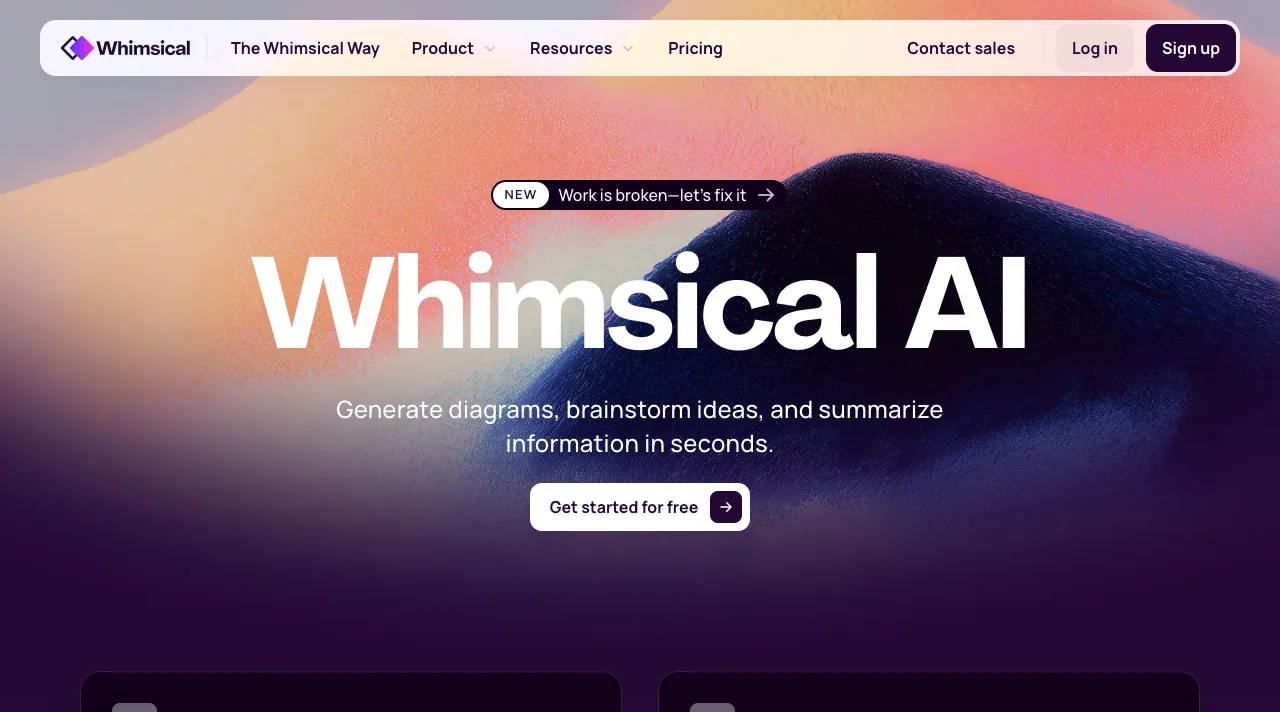
5. Use Whimsical AI for Optimized Mind Maps and Flowcharts
Whimscial is a great platform to manage projects, create clear documents, and communicate with your team members working on various tasks. But that’s just a brief introduction to Whimsical, because its AI now allows you to create highly customizable Mind Maps and Flowcharts.
Using its Boards functionality, you can access the Whimsical AI and use it to generate flowcharts and mind maps by simply adding a small piece of information.
Not only that, but it allows you to create Sticky notes as well as sequence diagrams.
The interface you get with Whimsical AI is rich and allows you to customize the infographic in multiple ways. For example:
- Customize the text size
- Change the color of the text
- Use different shapes
- Use icons
Likewise, you can utilize various options to create AI-generated infographics using Whimsical AI.
How to Create Infographics With Whimsical AI
Visit the official website of Whimsical and create your account.
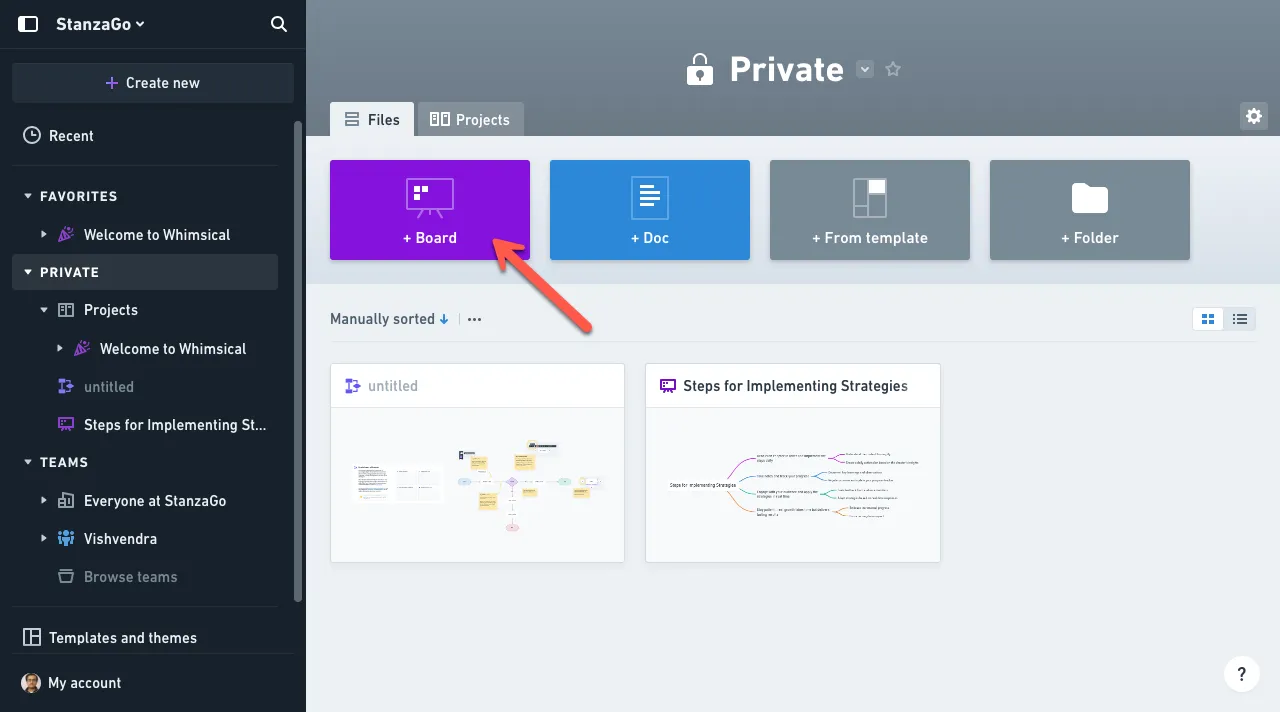
As you log in to your account, you’ll be directed to the Whimsical user interface. There, you need to simply click on the Board option.
Once inside the visual board, click on the Generate with AI icon.
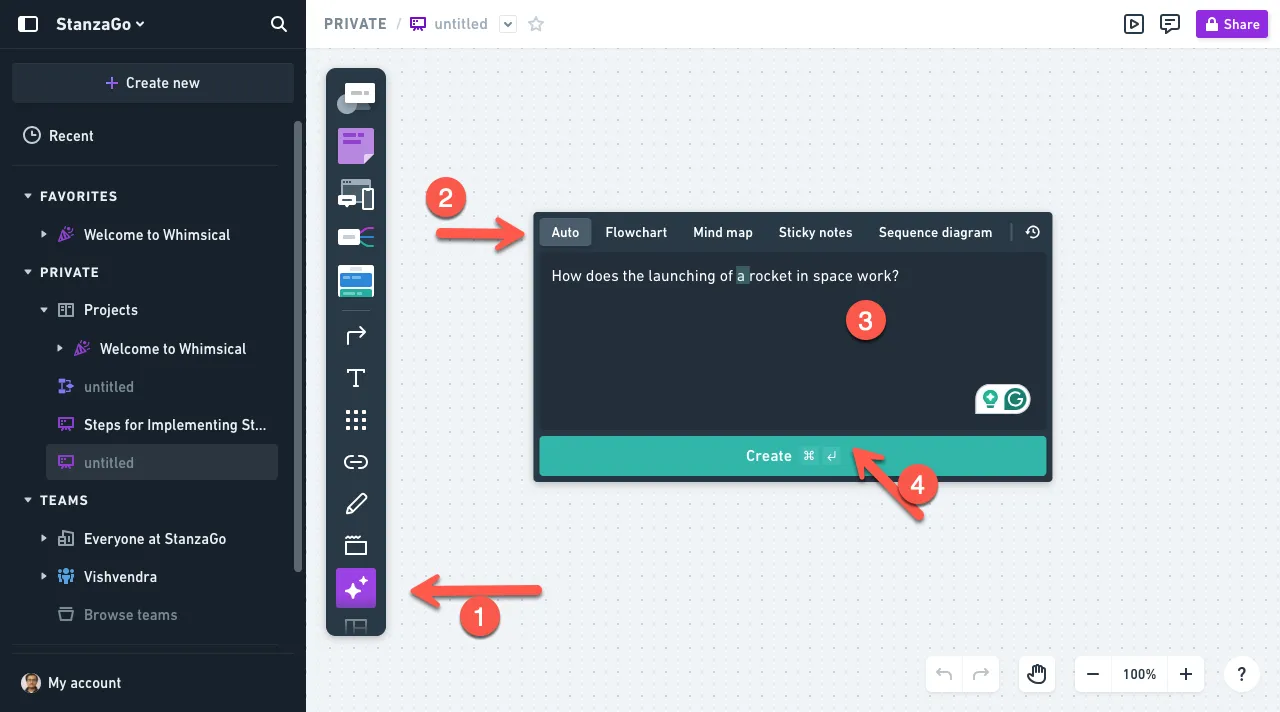
This will provide you with the dialog box to enter the details of your infographic, whether it’s a Flowchart, Mind Map, Sticky notes, or Sequence diagram. Once the information is entered, click Create.
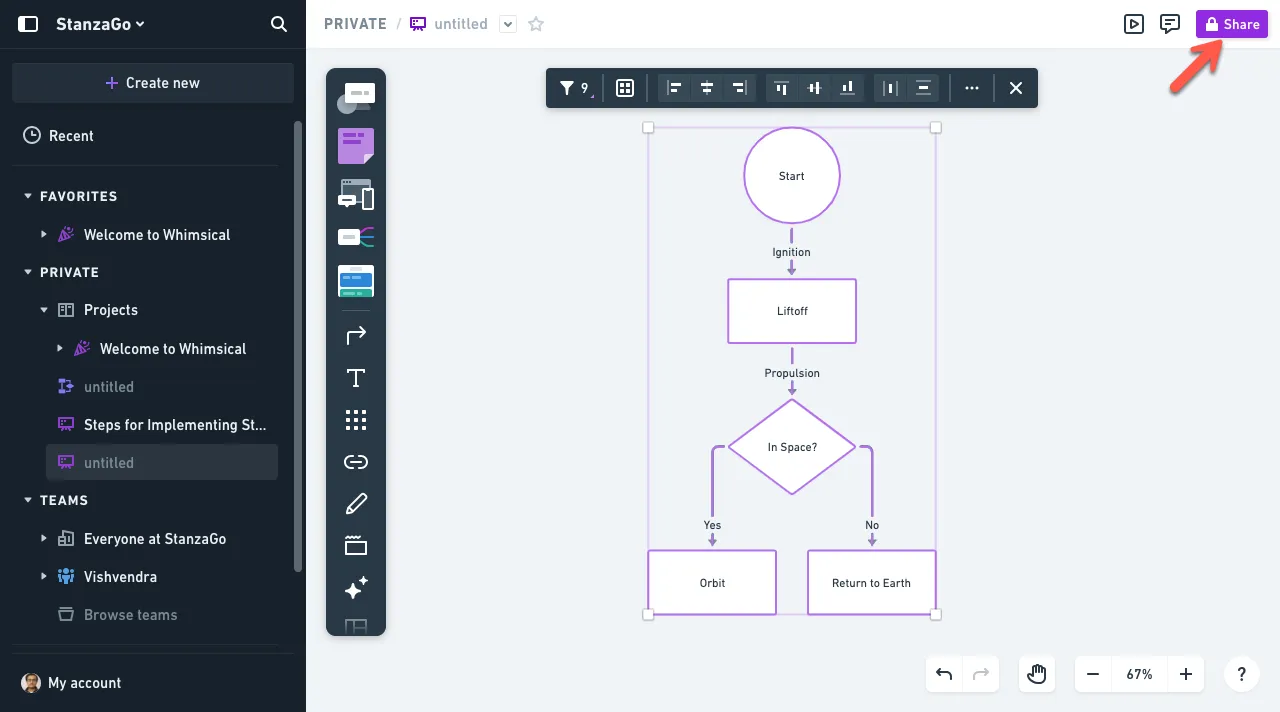
It will only take a few seconds to generate a visual representation of your information. Now, using the available options, you can edit it further. Once done with the customizations, click on the Share button → Export → Download.
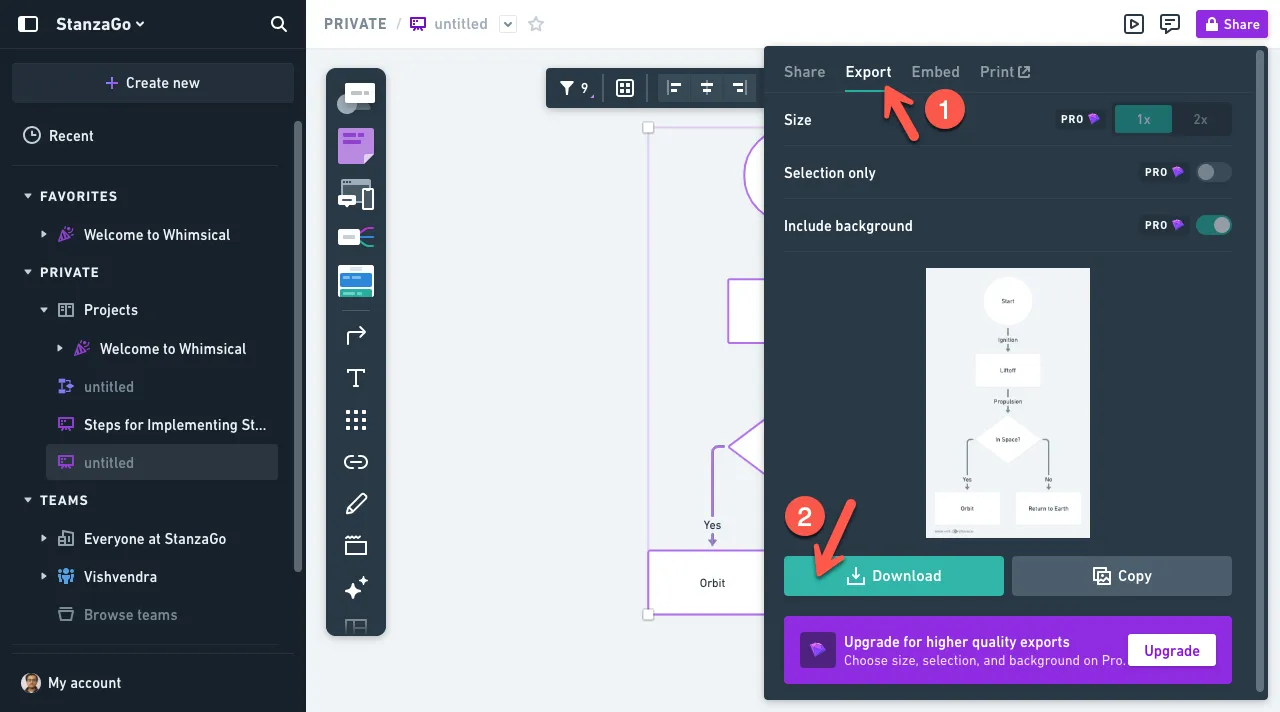
This will download your infographic, and you can use it.
Why Create an Infographic(s)?
Whether you publish content on your website or social media, visuals play an important role. Even if you are giving a presentation at your school, college, or the company you work for, without creative information, it’s hard to sell your point of view.
Therefore, to assist you in effectively laying out your vision or idea to the public, infographics play a crucial role.
Not only do they make your information effective, but they also allow you to:
- Make the information more engaging.
- Share information with the power of storytelling using creativity.
- Effectively explore a particular topic and share it with the public for better reach.
Lastly, you can have diversity in your content, whether on your website or social media.
So, it’s essential you create infographics, and using AI, it can become easier and efficient if you don’t know how to design them manually.
Or perhaps you know how to create infographics without using AI, but with the help of AI, you can go after designs that might not be possible on your own. Hence, use AI to design infographics and make things that were not possible before.
Best Practices to Create Infographics With AI Tools
There’s no one way to design infographics with AI.
But, by following the below practices, you can create such a type of informative visual that will make sense to your audience.
i. What Type of Information Is Best Suited for Infographics
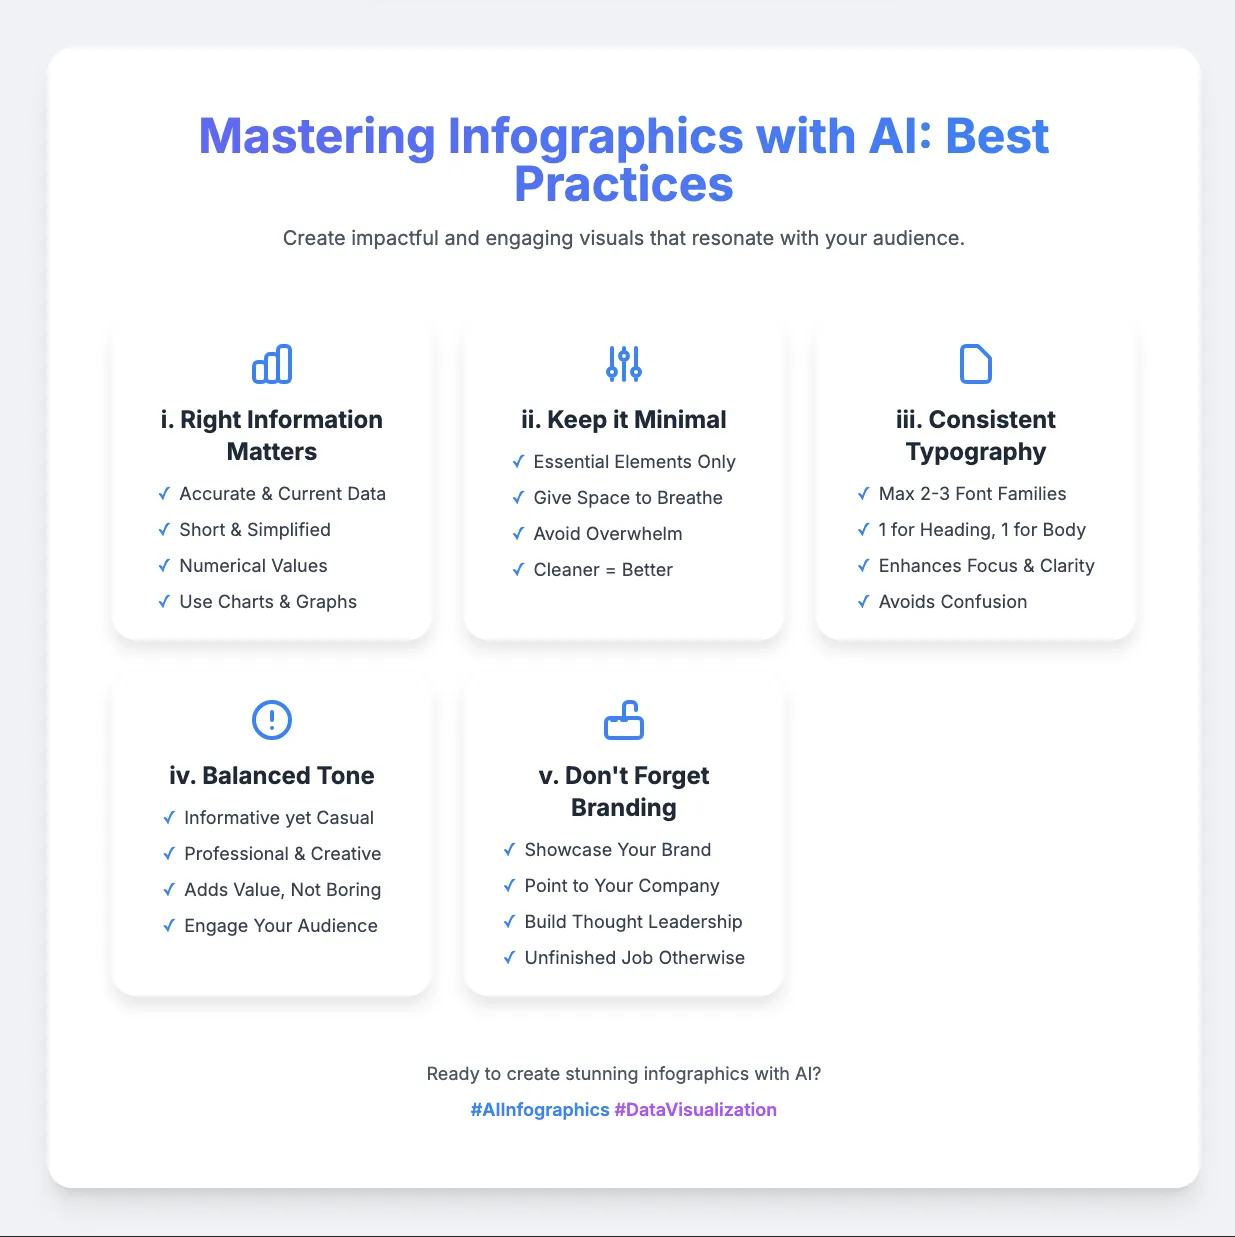
With infographics, the goal is to educate the audience with actual and current data. Your responsibility is not to overwhelm them. Therefore, always try to add information in your infographics that is:
- Accurate and current.
- Short and simplified.
- Interpreted with numerical values.
- Visualized using charts or graphs.
In this way, you’ll create infographics that serve your purpose magnificently.
ii. Keep Minimal or Essential Elements
With infographics, you want to educate your audience as much as possible. However, in the pursuit of that, don’t make the infographics a fish market.
Don’t add everything on the plate and make it uneatable.
Give space to the elements and information to breathe. To easily sync in the mind of the user. The more spacious your infographic is, the better it will look and capture the attention of the user.
Therefore, when you create your infographic with AI, ensure it’s minimal and uses only essential elements. And one other thing: nothing that would overwhelm the user.
iii. Utilize Uniform Font-family in the Typography
The standard practice of designing is that you should use a maximum of 2 font families. Or perhaps 3, but not more than that. One font-family for the heading, and another for the body text.
In this way, you easily allow your audience to focus on the information you have added in the infographic.
However, if you use more than 2 or 3 font families, the words just create confusion and unfamiliarity. It becomes harder to distinguish which part of the information is essential and which is not.
Therefore, stick with only 2, and if there’s scope, then 3, but not more than that.
iv. Keep a Balanced, Informative, and Casual Tone
Yes, it’s good to keep the tone of the content professional, but don’t forget how creativity works.
If it’s not moving your audience, there’s no use in using it.
That’s why when you prompt AI infographic generators, you should prompt them in a way that the generated content should add value to the user, plus, it doesn’t look like a boring piece.
The balance is needed. So, ensure that your infographic is effectively using the right tone.
v. Don’t Forget About Branding
Most of the time, the purpose behind sharing highly informative content is to present oneself as a thought leader and an expert in a particular field. The goal is to convince the audience and somehow make them believe in the services and products you have.
If your infographics aren’t showcasing your brand or your initials, then they are doing an unfinished job.
Therefore, when you create infographics with AI, ensure you provide them with your brand’s resources. Or perhaps something that would point towards your company or even you.
FAQs
1. Where can I make an infographic for free?
The tools we discussed above all offer a free plan to design infographics with AI. If Gemini AI is suitable for you, you can use it. Or perhaps, you prefer AI and a human touch, then you can combine Sora and Canva. For fast and creative infographics, you can use Gamma, Napkin, and Whimsical.
2. How do I create interactive infographics?
To create interactive infographics, you can use Gemini AI, which provides you with infographic code that you can use on your website and allows visitors to interact with it.
3. Can ChatGPT create infographics?
Yes, you can create infographics using ChatGPT. However, by accessing Sora, you get additional image configurations, for example, dimensions and variations.
Conclusion
By analysing all the information, we can reach the conclusion that in order to create infographics, you can effectively use AI. Tools like Google Gemini allow you to create interactive infographics based on the report or share small amounts of information.
You can then use it on your website or simply create an image with the preview link.
Similarly, if you need to create infographics that can have some kind of creative touch, show some engagement to the user, you can use Napkin AI. It allows you to select one pre-built template, then open multiple templates to improve the infographic.
With AI, it becomes easier to create infographics and share your information in the most attractive way, improve the content presentation as well, and present yourself as a thought leader in the industry.
Now, it’s your turn to try all of these tools and make sure that you create infographics keeping the user intent in mind. That you don’t just try to sell your point excessively, but present the information in a way that feels useful to the user, and they can make the most out of it for the problems they are facing.